Features
Price the put, take the assignment, write calls on the shares, and total the year.
One engine prices 58 strategies off the real chain. One ledger carries the campaign from the put through the assignment to the call-away, taking every premium collected off the basis on the way — so an $85 put assigned six weeks ago still reads as 100 shares at $82.95, open, with the put that produced it attached.
- $82.95
- HOOD basis after an $85 assignment and $205 of premium
- $0.00
- the close price of a put that expired worthless
- $130.54
- 1,000 PLTR assigned at $140, less $9,460 of calls written since
- 1,667
- candidates priced off one SPY chain and ranked, in under a second
Builder & strike ladder
You want to know what an $87 put on HOOD pays before you tie up $8,700.
Pick a ticker, pick a type, and the legs arrive priced off the real chain. Every leg is a chip on the strike ladder: drag it and the credit, the collateral, the breakeven, the chance of profit and the net Greeks all land on the same frame, because the engine runs in your browser rather than on our server.
No account
- HOOD, 4 September, one $87 put: $650 credit against $8,700 of collateral, breakeven $80.50 — 7.0% under the $86.56 mark — and a 60% chance of profit.
- Net delta, theta, gamma, vega and rho for the position sit on the same bar, and every leg carries its own set in the editor — solved from that leg's own implied volatility, not one number smeared across the trade.
- 58 templates, from cash-secured puts and covered calls to broken-wing butterflies, jade lizards and double diagonals — plus a blank one you drop your own legs into.
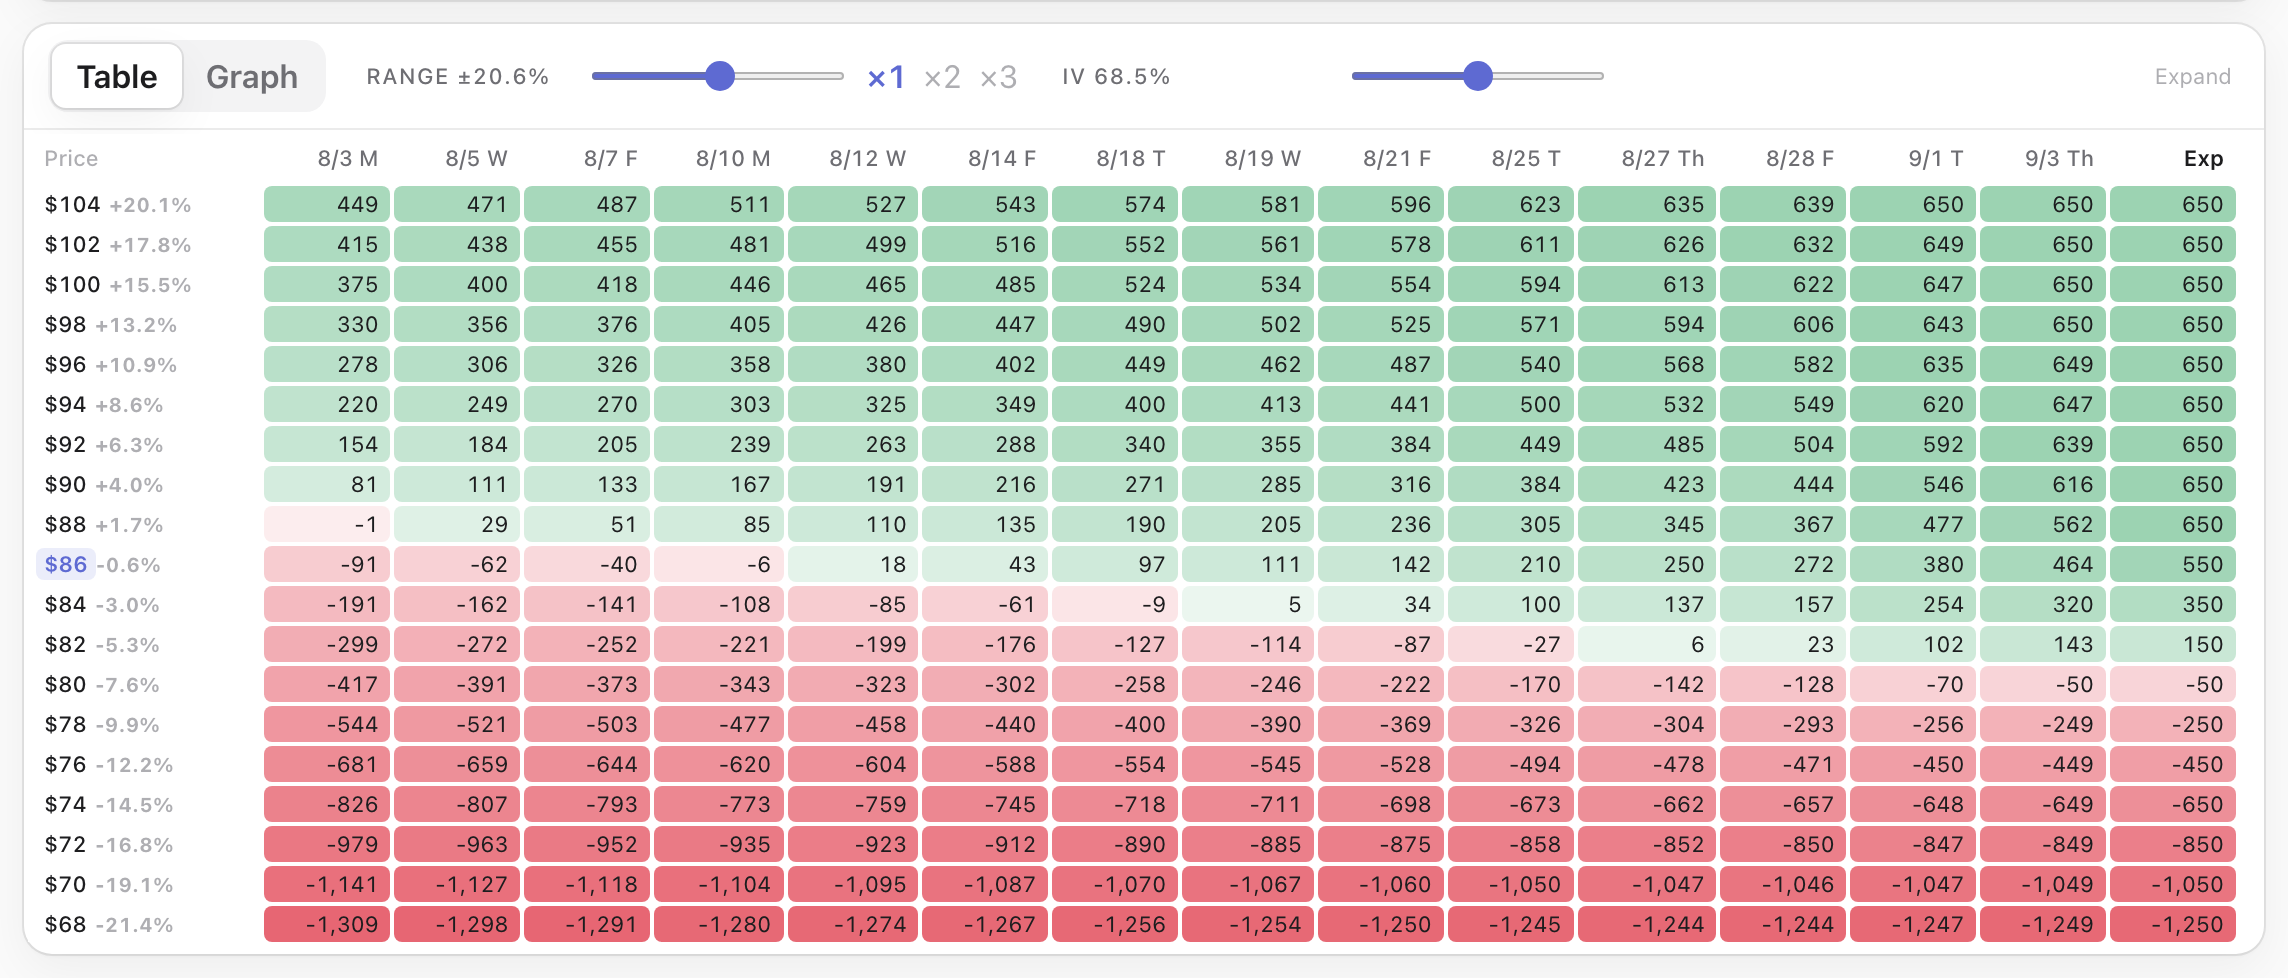
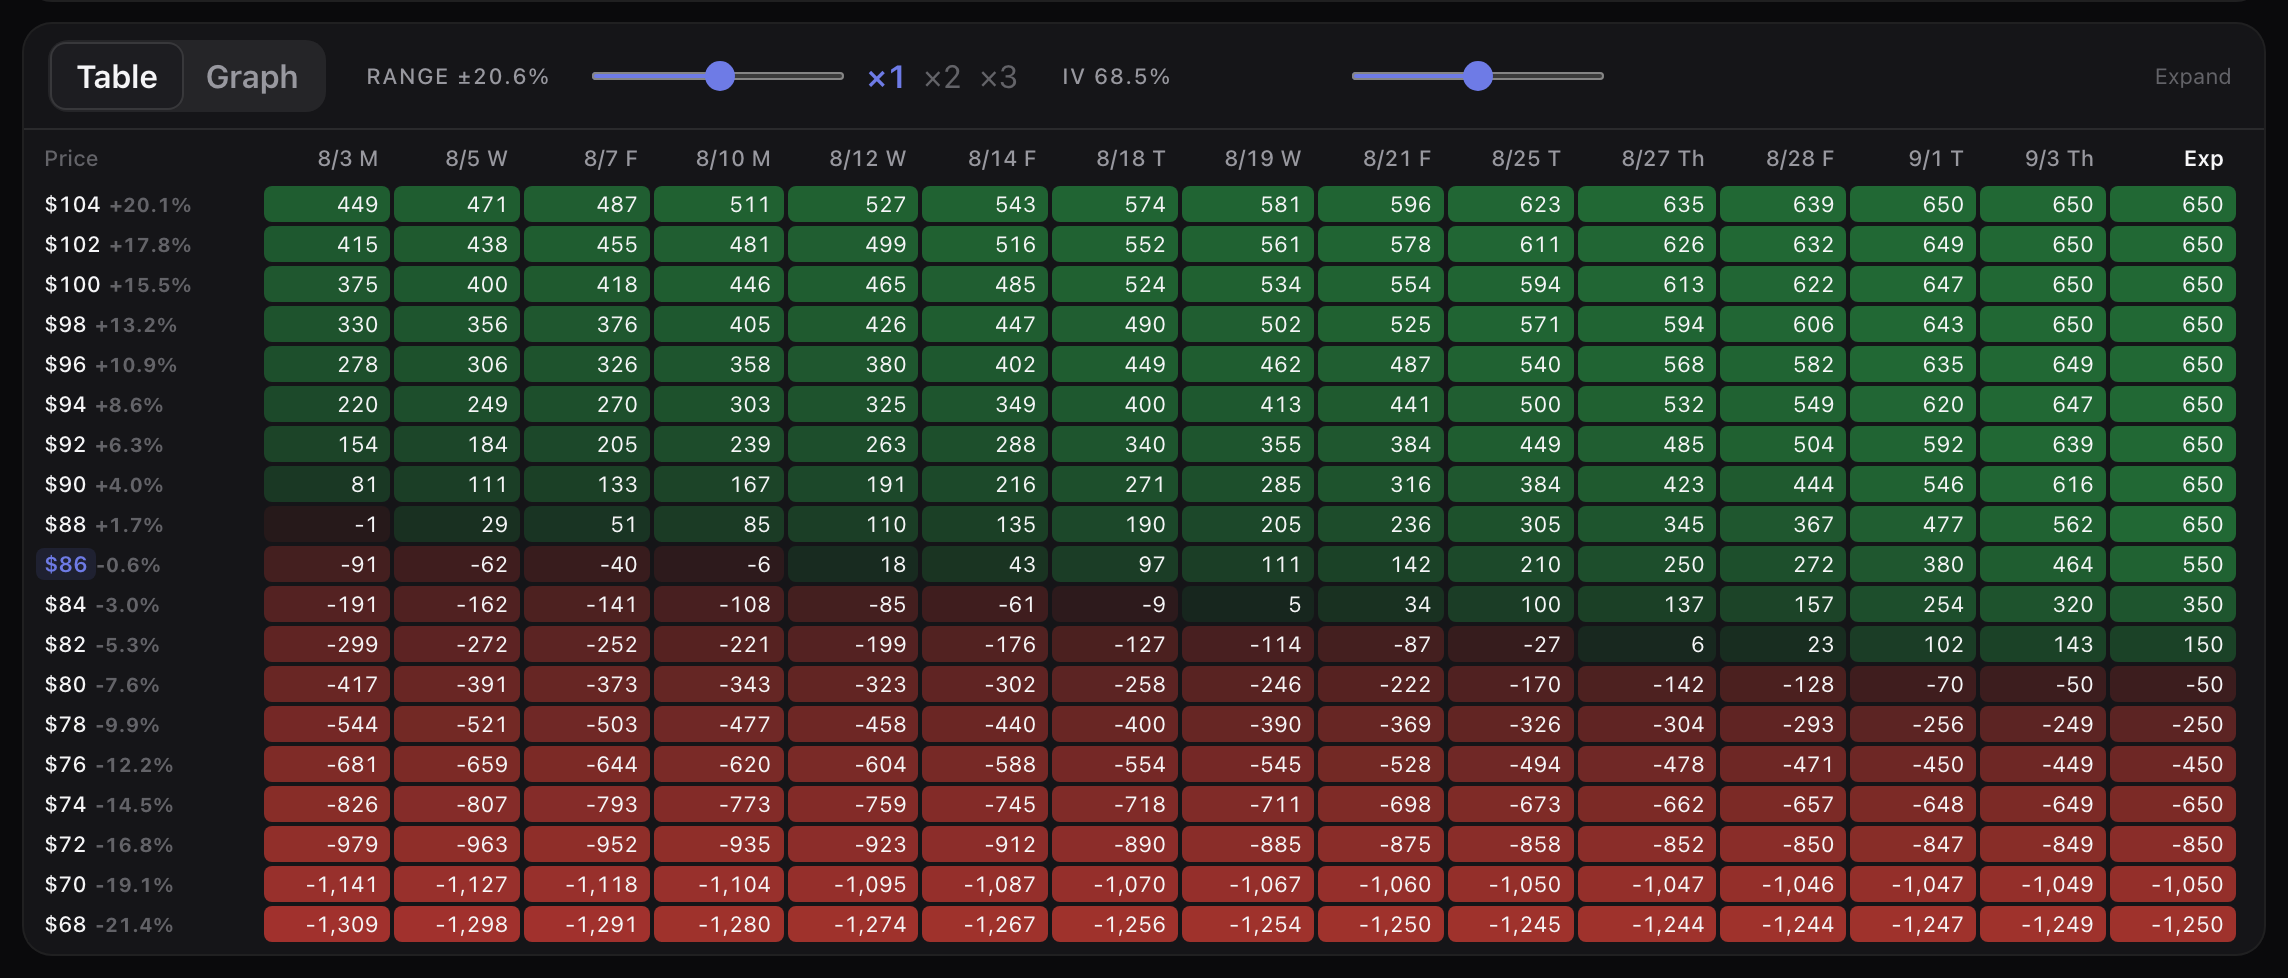
- The price × date grid prices every trading day between now and expiry. At expiry that put keeps the whole $650 anywhere above $87, hands back $550 at $86 and costs $1,250 at $68 — and every column to the left of it is the same position with time still on the clock.
- Only strikes that actually trade appear on the ladder, with the spot marker where the stock is and ± nudges for precision.
- The builder opens at full strength on the first click, with no session: a ticker, a type, and the legs arrive priced.
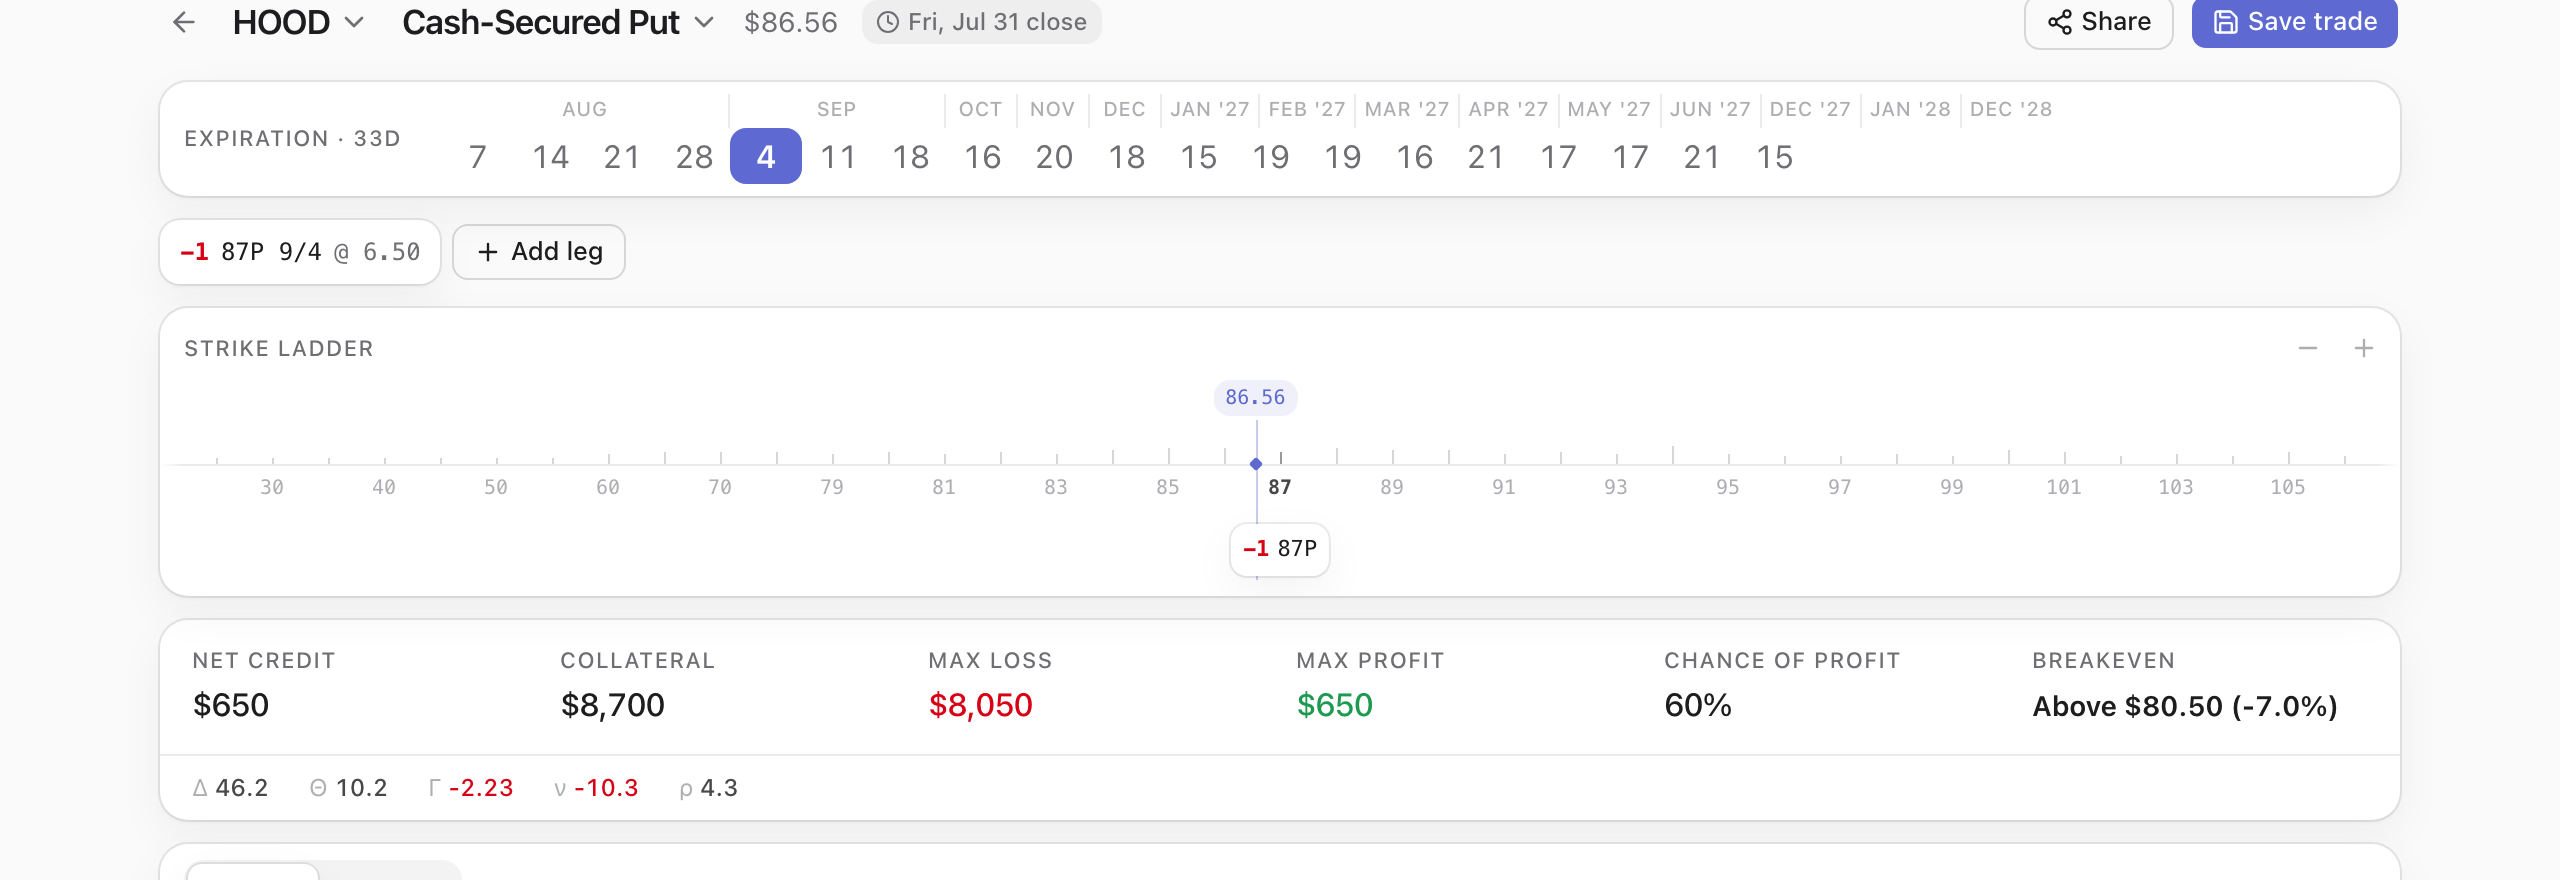
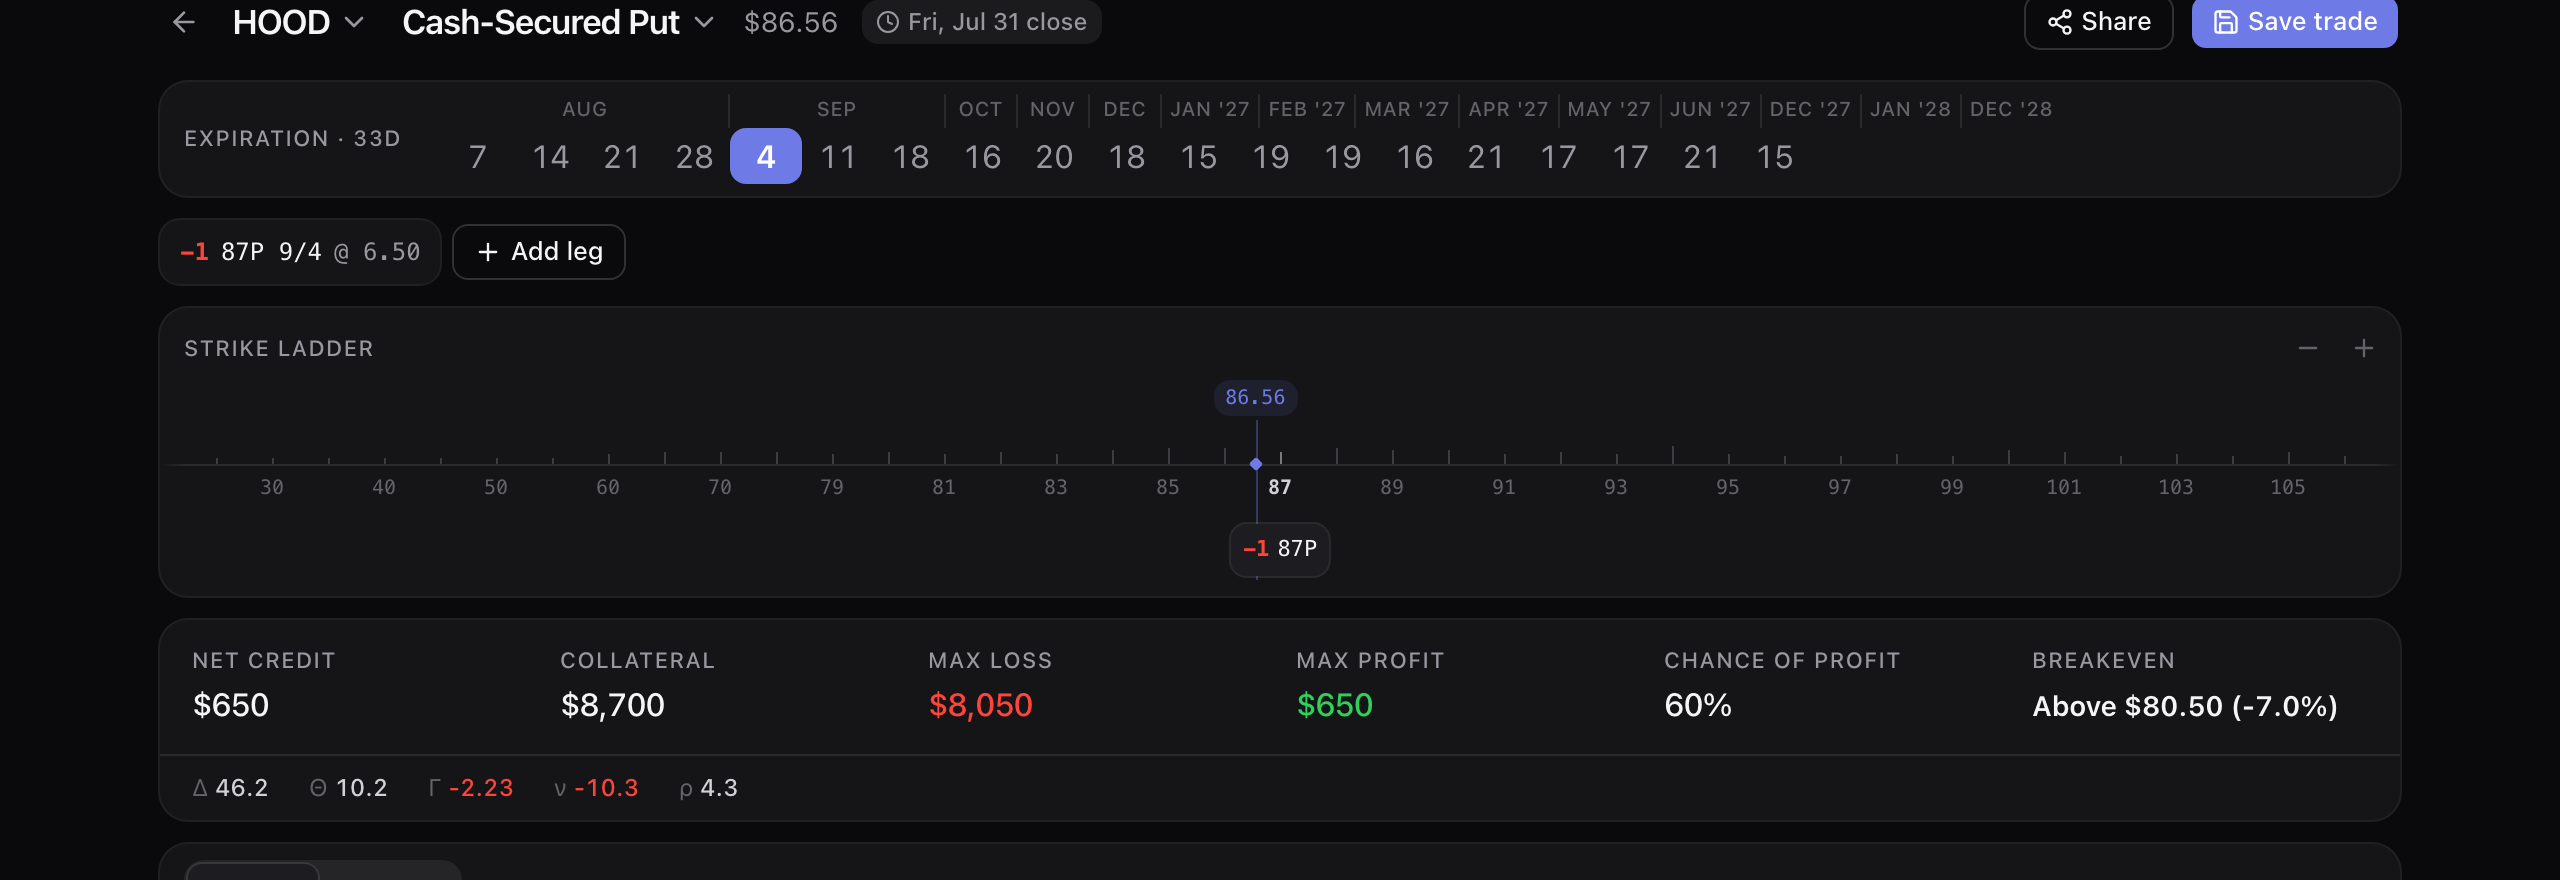
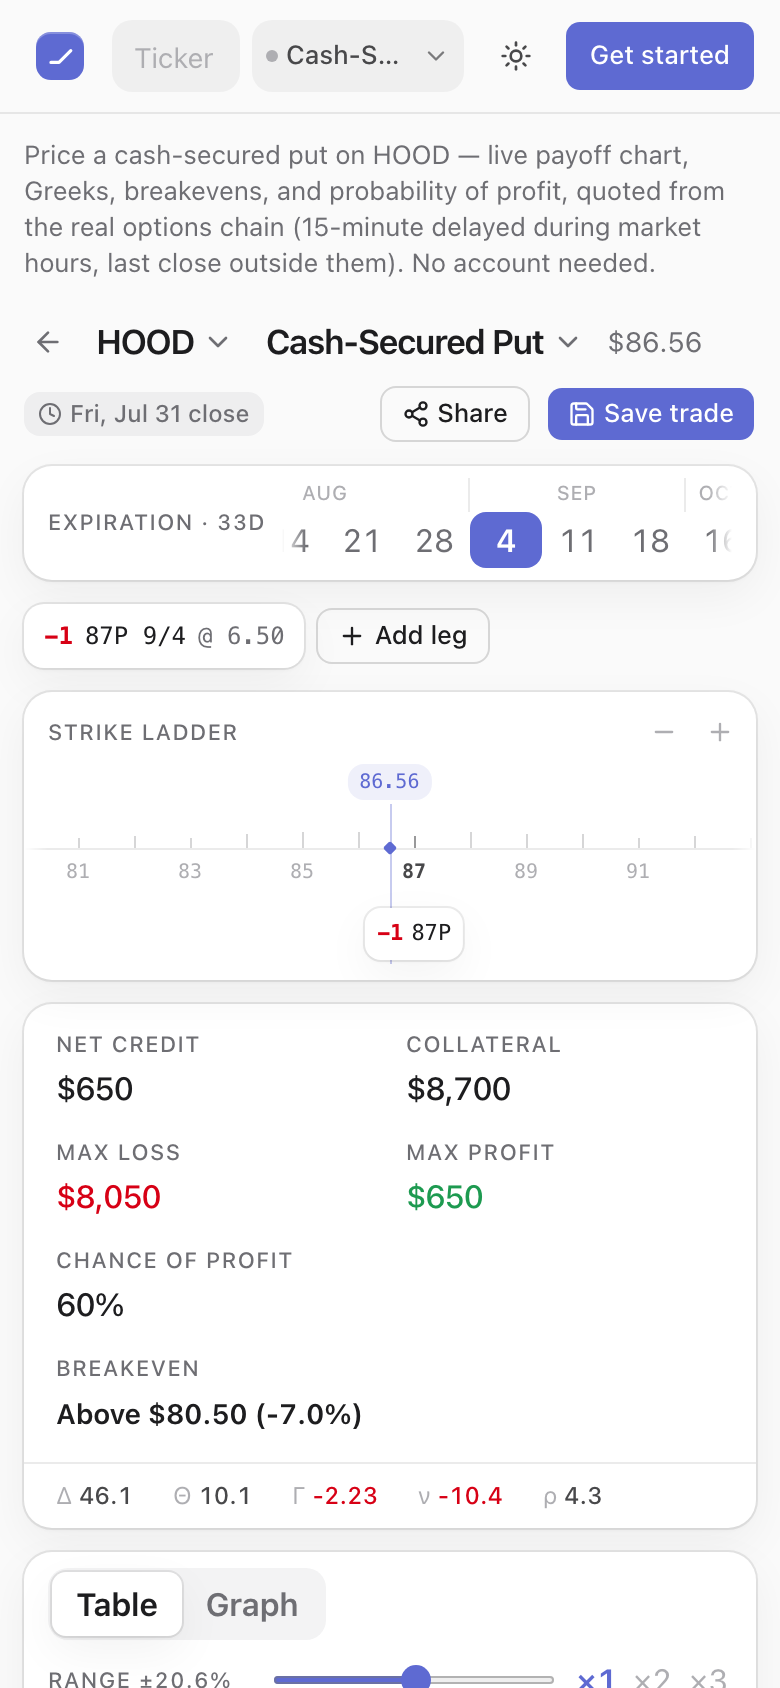
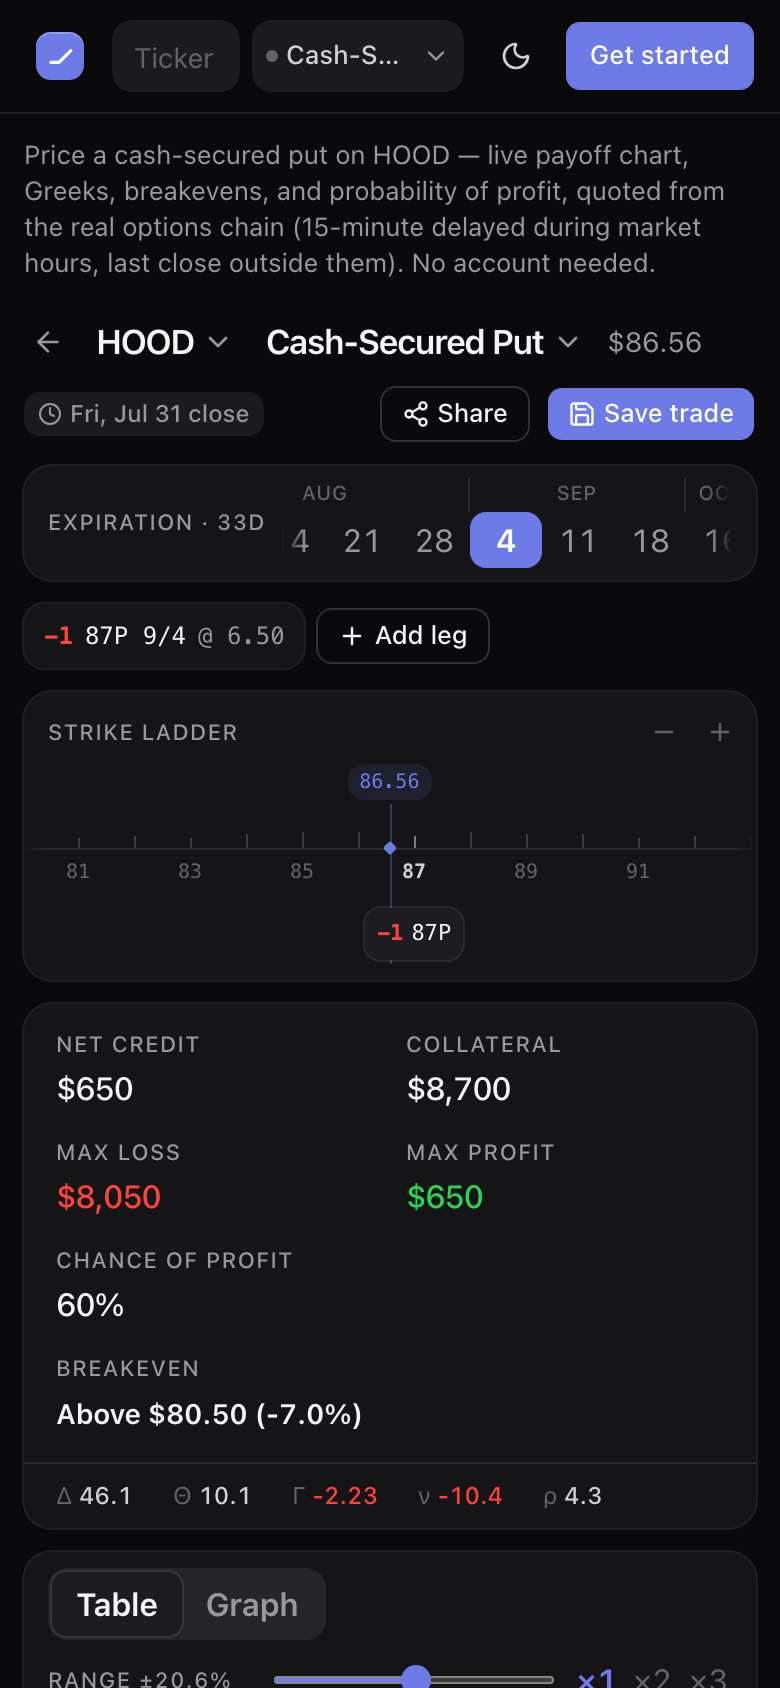
The same builder at 390 pixels, one-handed: the ticker and type controls sit side by side at the top, the ladder drags under your thumb with a magnified strike readout, and the summary keeps all six figures — $650 credit, $8,700 collateral, $8,050 max loss, $650 max profit, 60% chance, breakeven $80.50 — without a horizontal scroll.
Wheel & covered calls
You sold a put you were happy to own the stock at. It got assigned six weeks ago and you still hold the shares.
Assignment is the middle of the trade, not the end. The cycle stays in the open list with the shares attached, the premium you already collected comes off the basis, the put that produced it stays on the timeline, and the next action — sell a covered call — is right there on the card.
Free account
- HOOD: $85 put sold 18 June for $205, assigned 17 July. Six weeks on it still reads 100 shares at an $82.95 adjusted basis, $3.61 under the $86.56 mark, badged “Shares held”.
- That cycle’s numbers: +$205 realized, +$361 including the unrealized share move, against the $8,500 the assignment actually tied up — and the yearly rate on the card is computed on that capital rather than on the premium.
- Nothing auto-closes. A cycle ends when you close it or when the shares leave — never because a leg expired, was assigned or was bought back. A partial assignment leaves the remaining contracts live.
- AAPL: assigned at $210, then a $220 call that expired worthless and a $217.50 call still running — $515 banked, basis $204.85.
- PLTR: 1,000 shares assigned at $140 and $9,460 collected across three calls and a buy-back — the position reads $130.54 a share, not the $140 strike.
- Close, expire or assign at any price the field accepts, $0.00 included. The closed KO cycle under the open ones sold an $86 put for $1.10 on 8 July and let it expire: +$110.00 realized against a $0.00 cost basis, the whole credit, on the $8,600 the put tied up. It ran 25 days, so the row reads “+1.3% over 25d” rather than that number multiplied by 365.
- Shares you bought rather than got assigned run the same way. The KO cycle at the top of the list holds 100 shares at $84.20 and sold a $90 call for $1.26; the call expired worthless, so the basis reads $82.94, +$126.00 is realized, and the cycle went back to “Shares held” instead of closing.
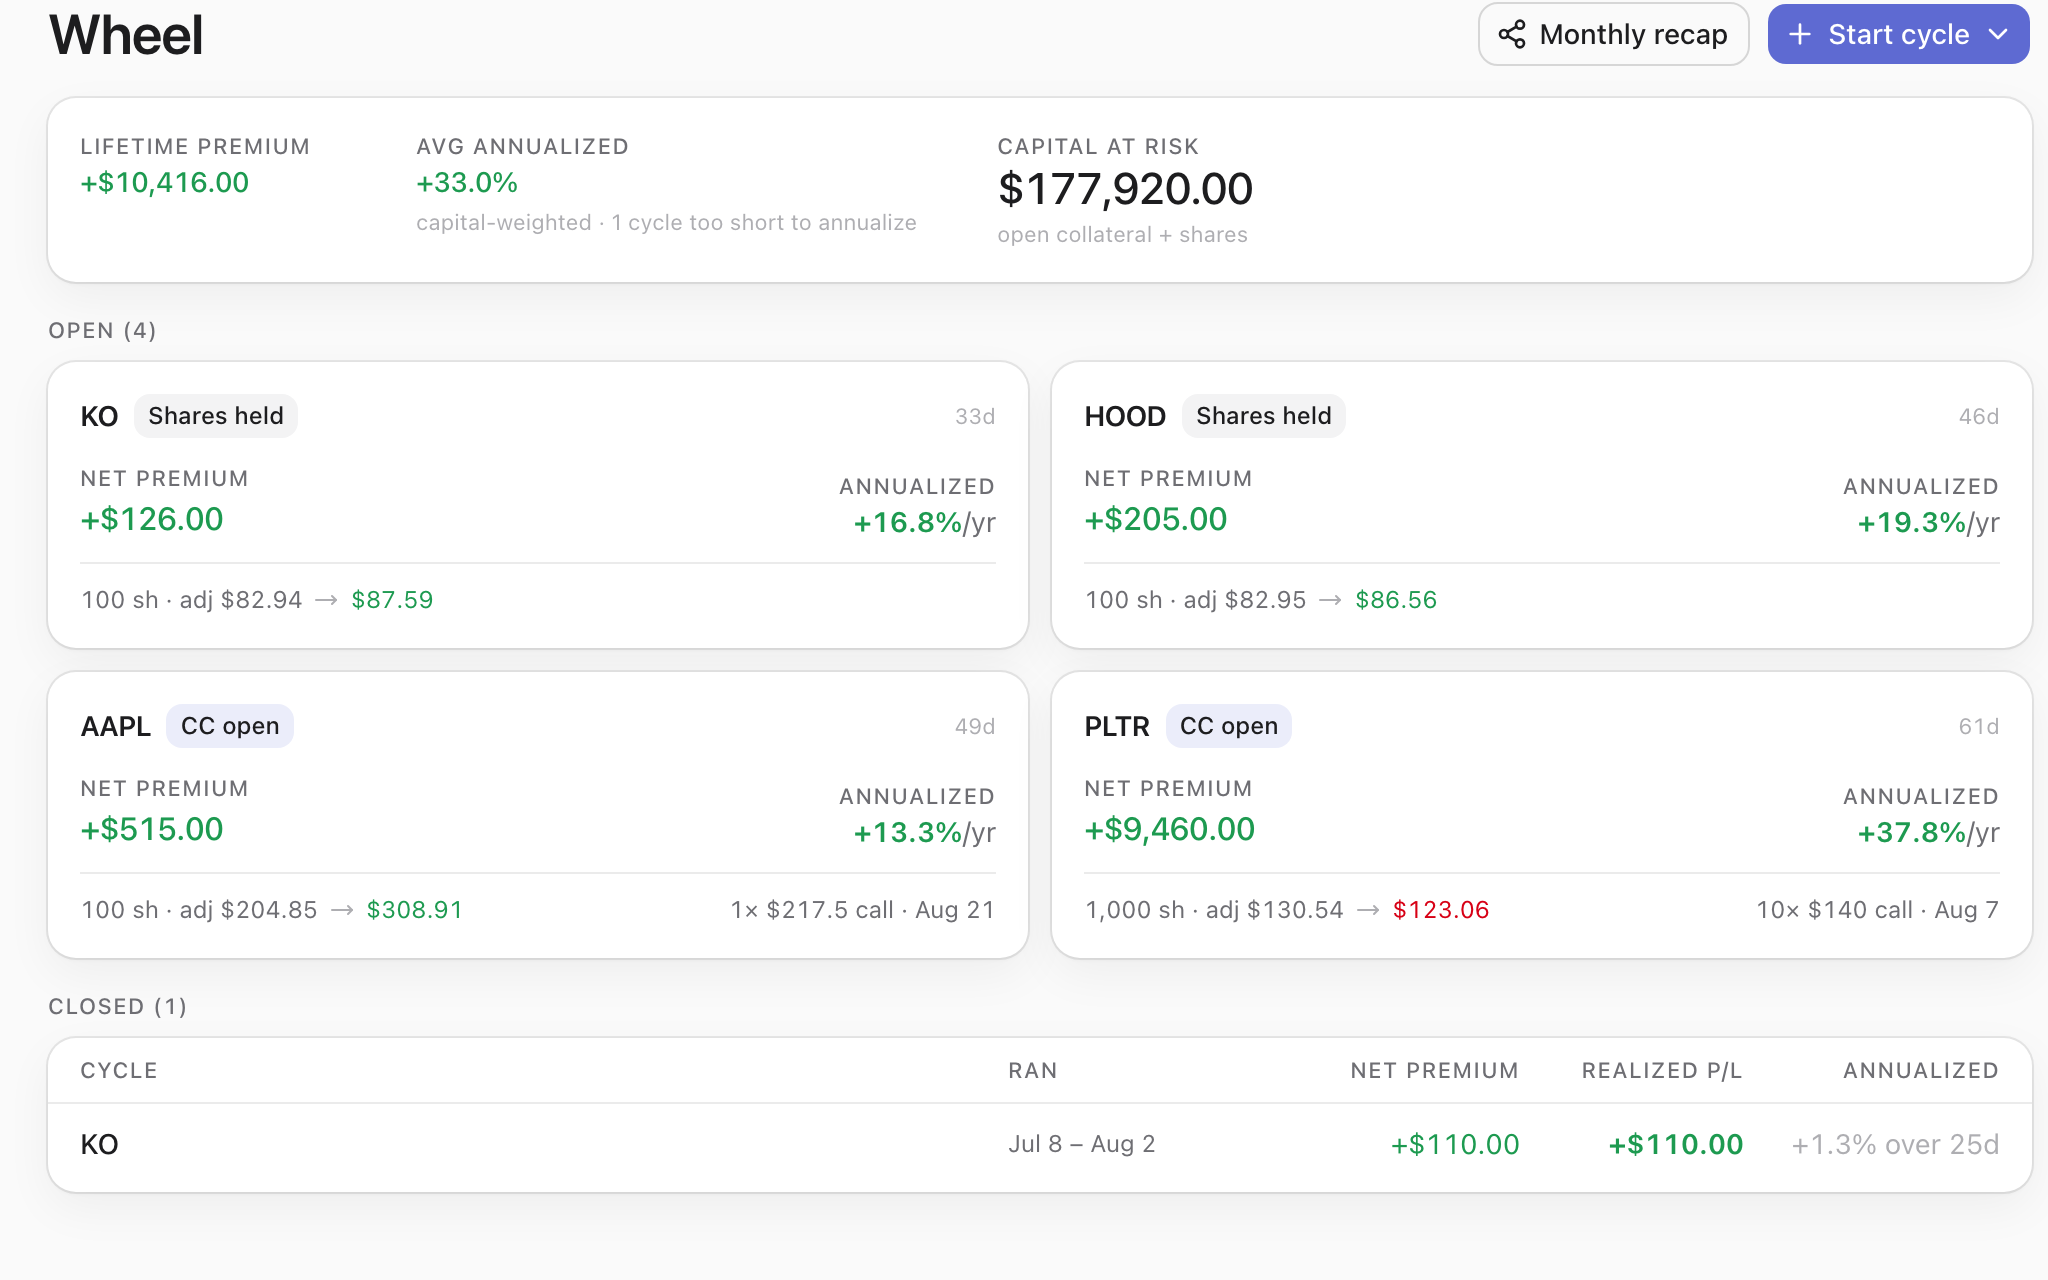
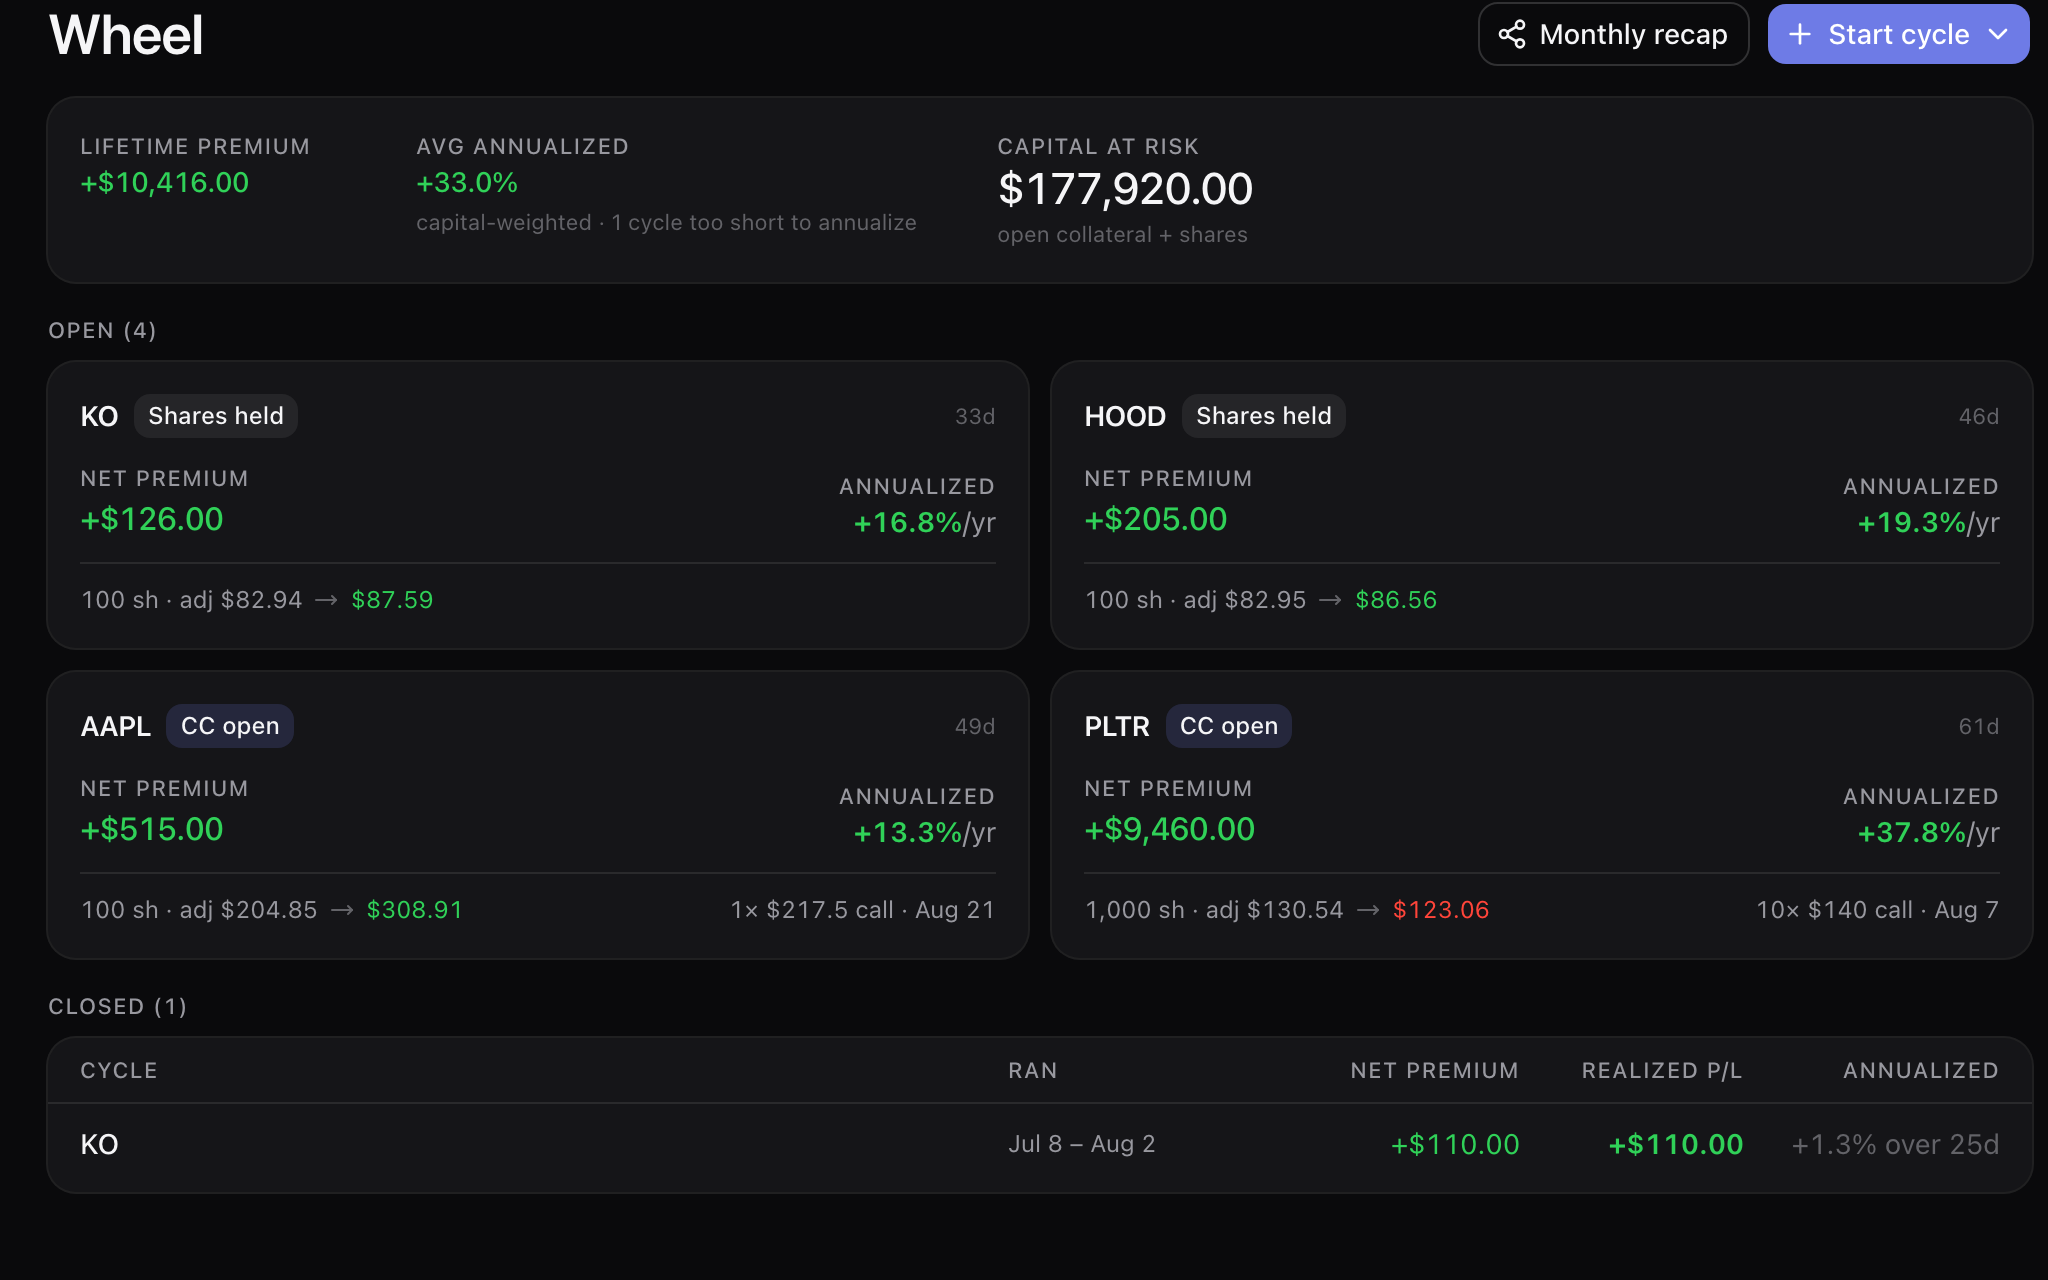
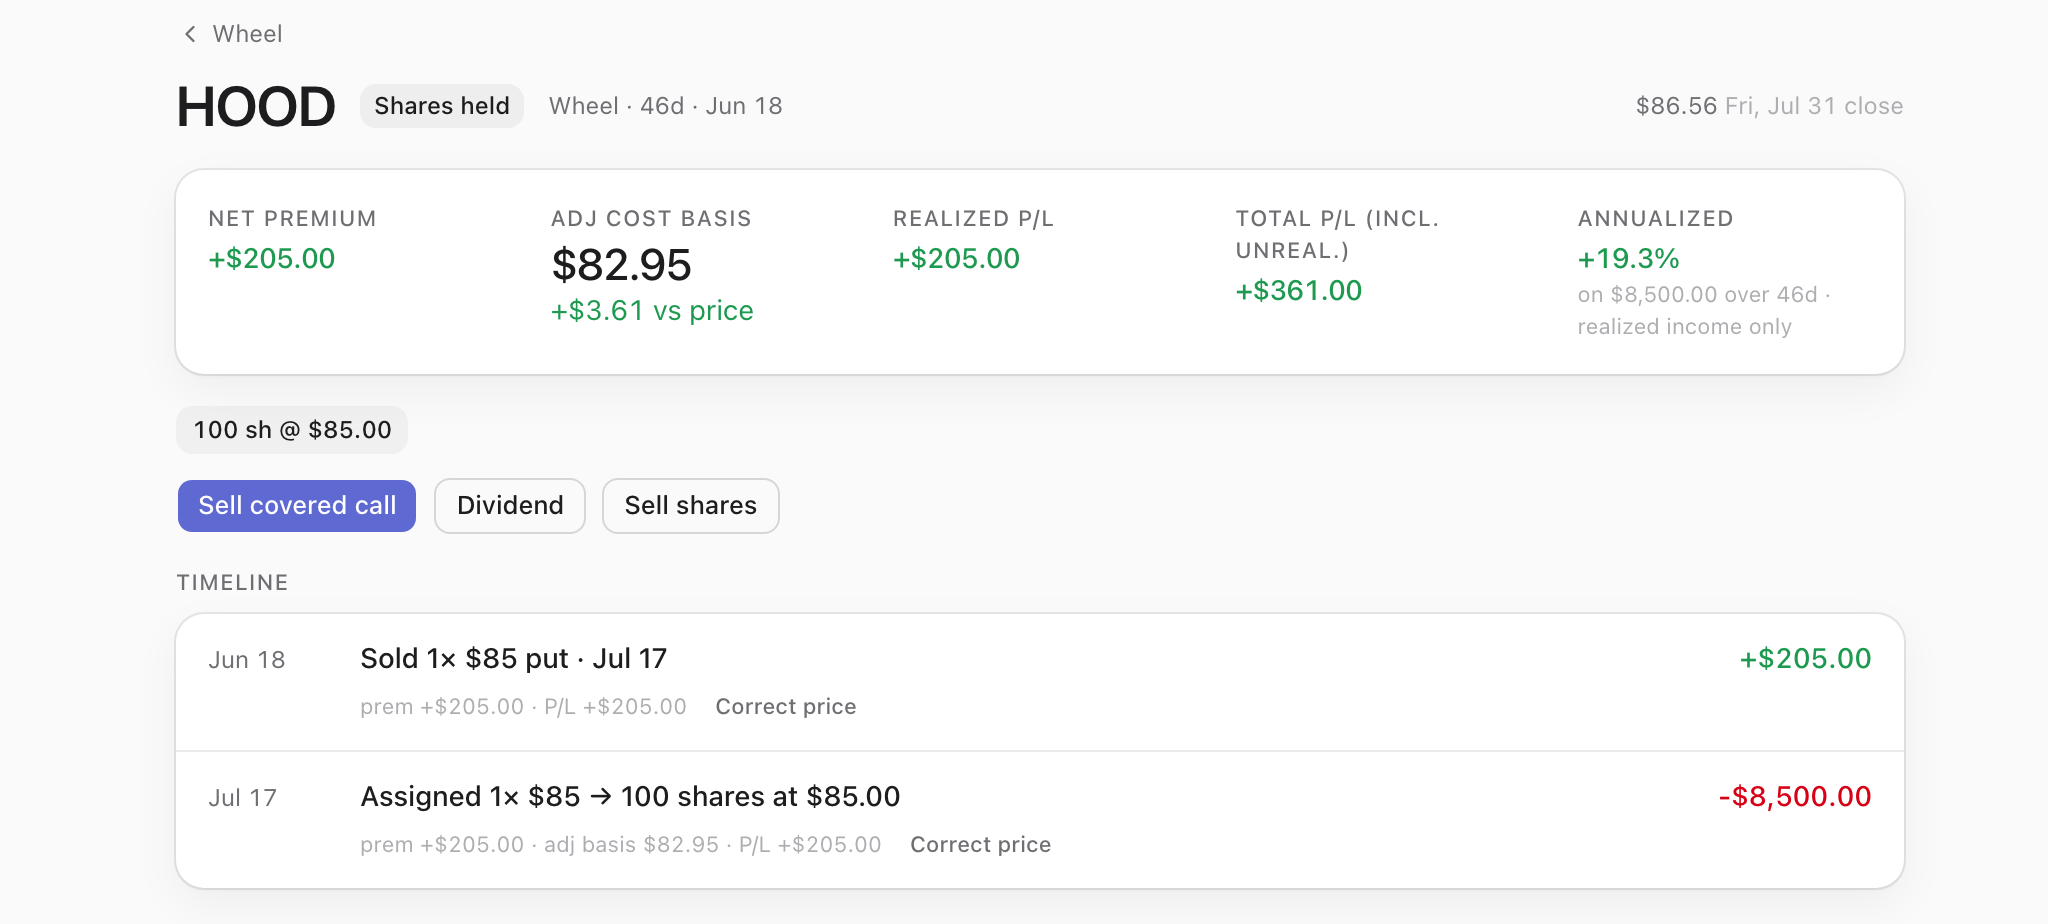
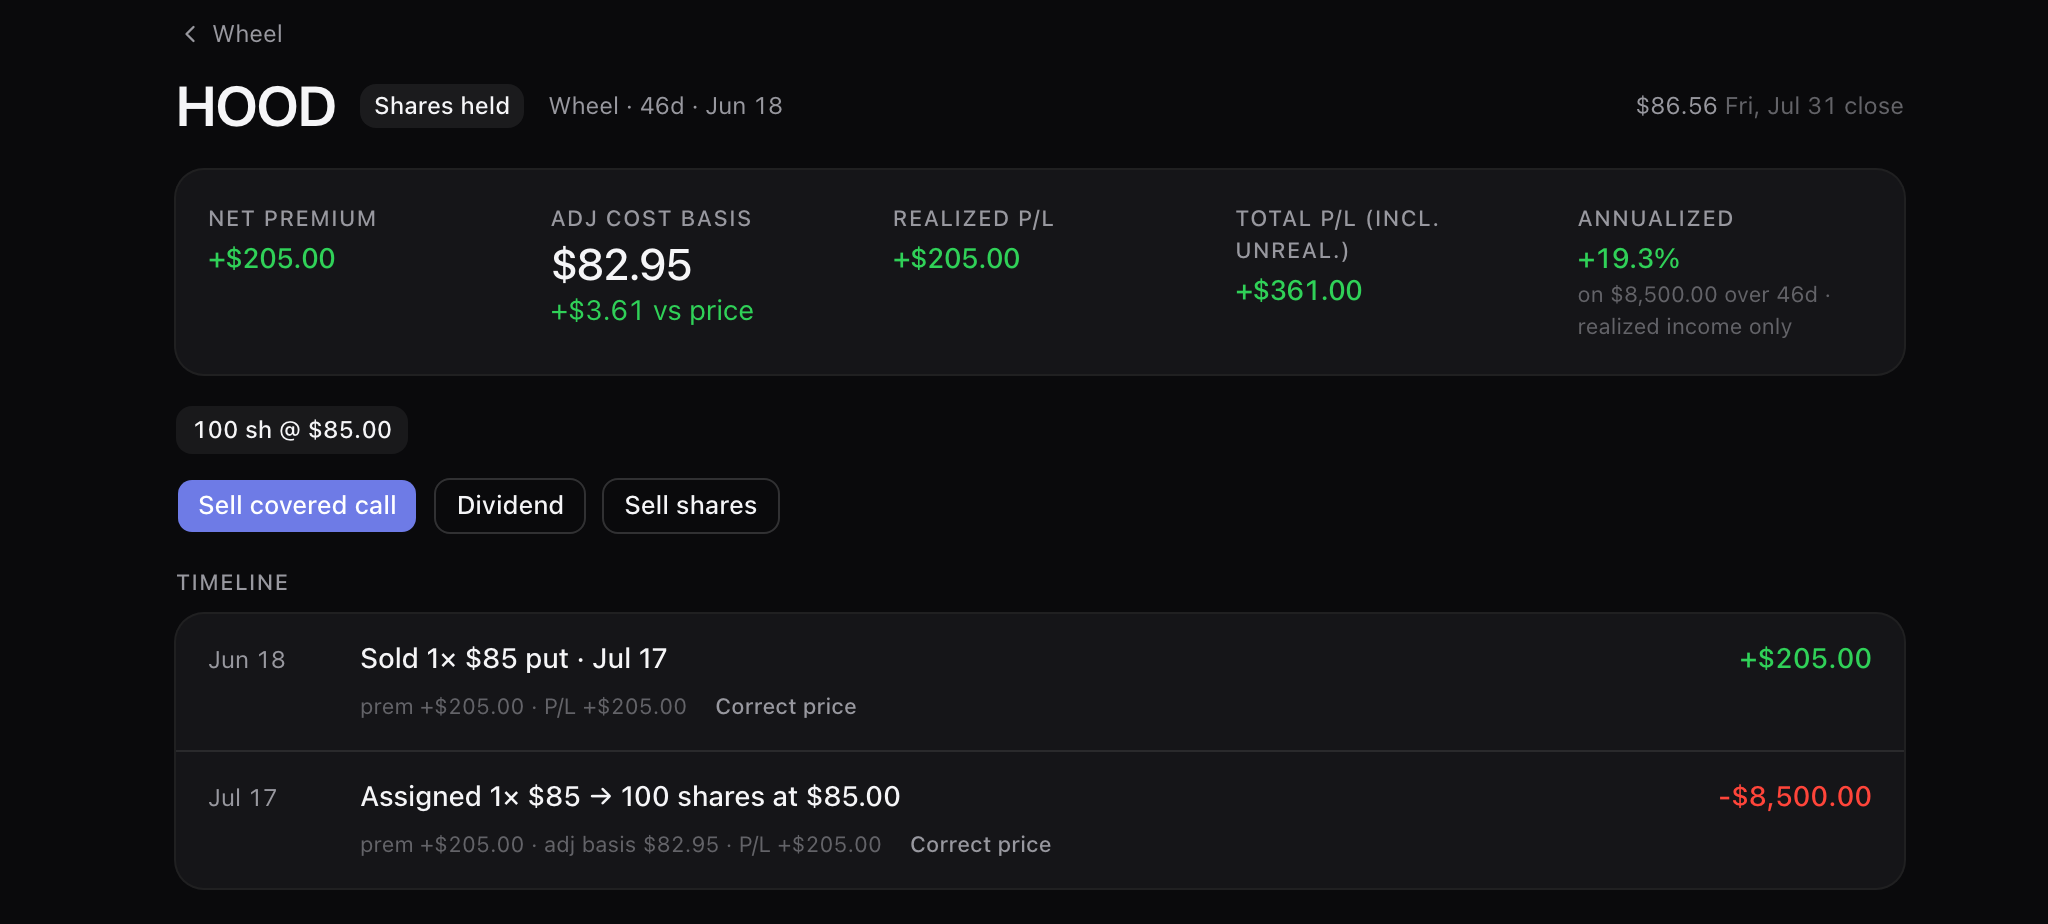
Six weeks after the option leg stopped existing, the trade is still a trade: open, on the wheel screen, with the put that created it attached and the covered call it wants next offered as a button. The badge says what the position actually is — “Shares held” — rather than filing it under expired.
Cost basis & realized
The shares that assignment handed you are a holding with a history, not a loose lot.
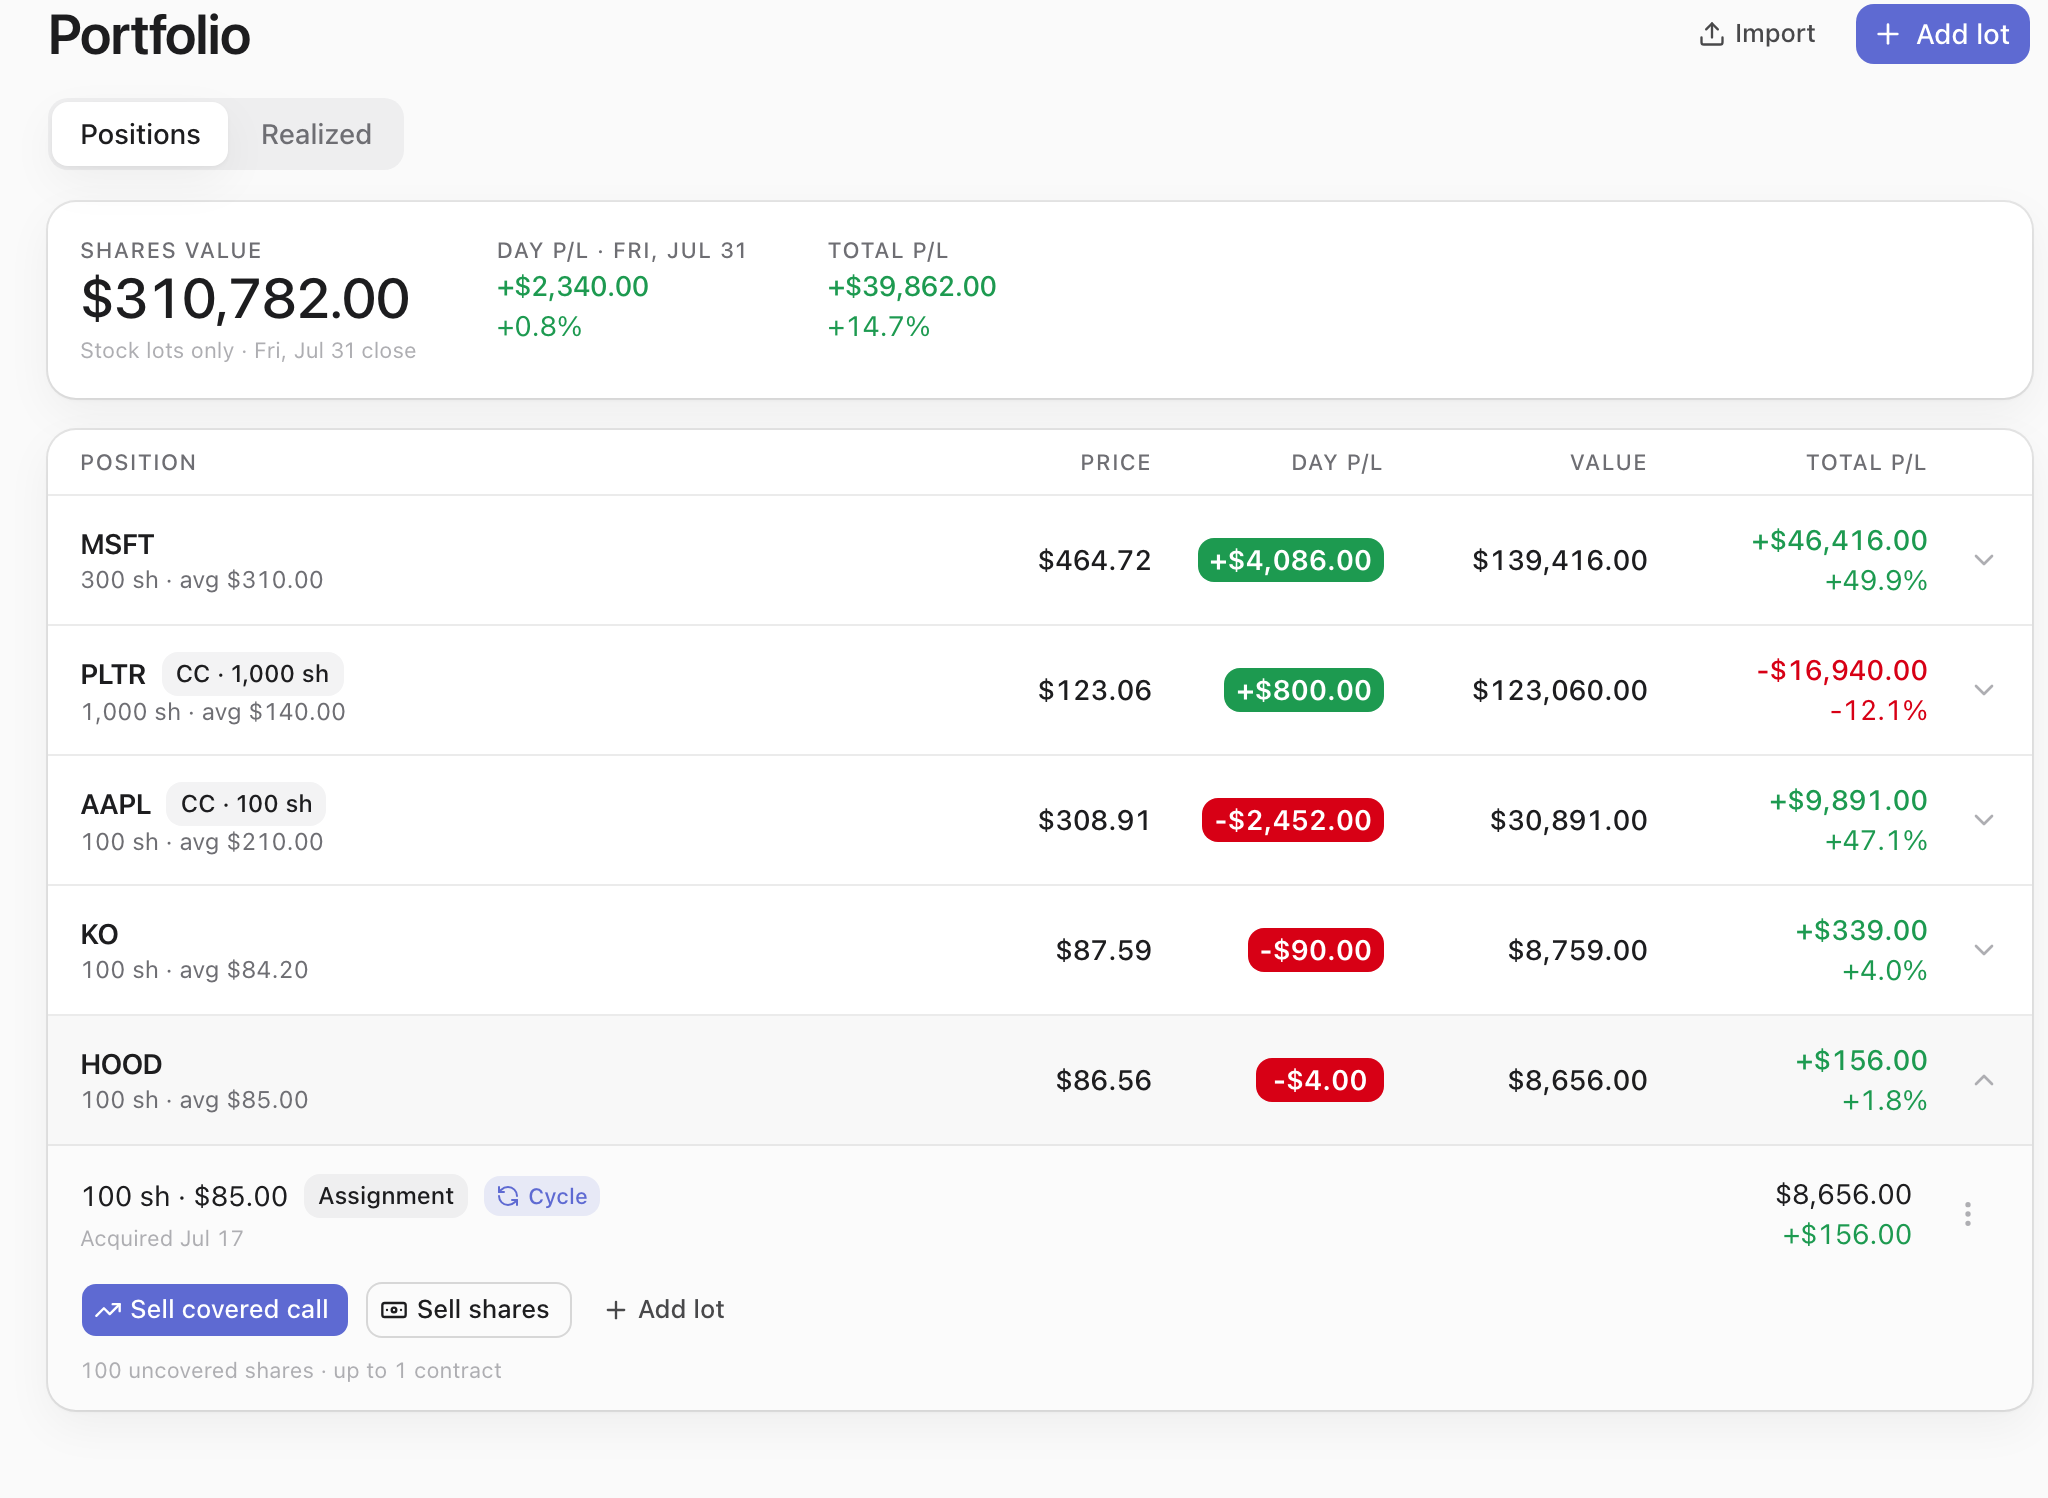
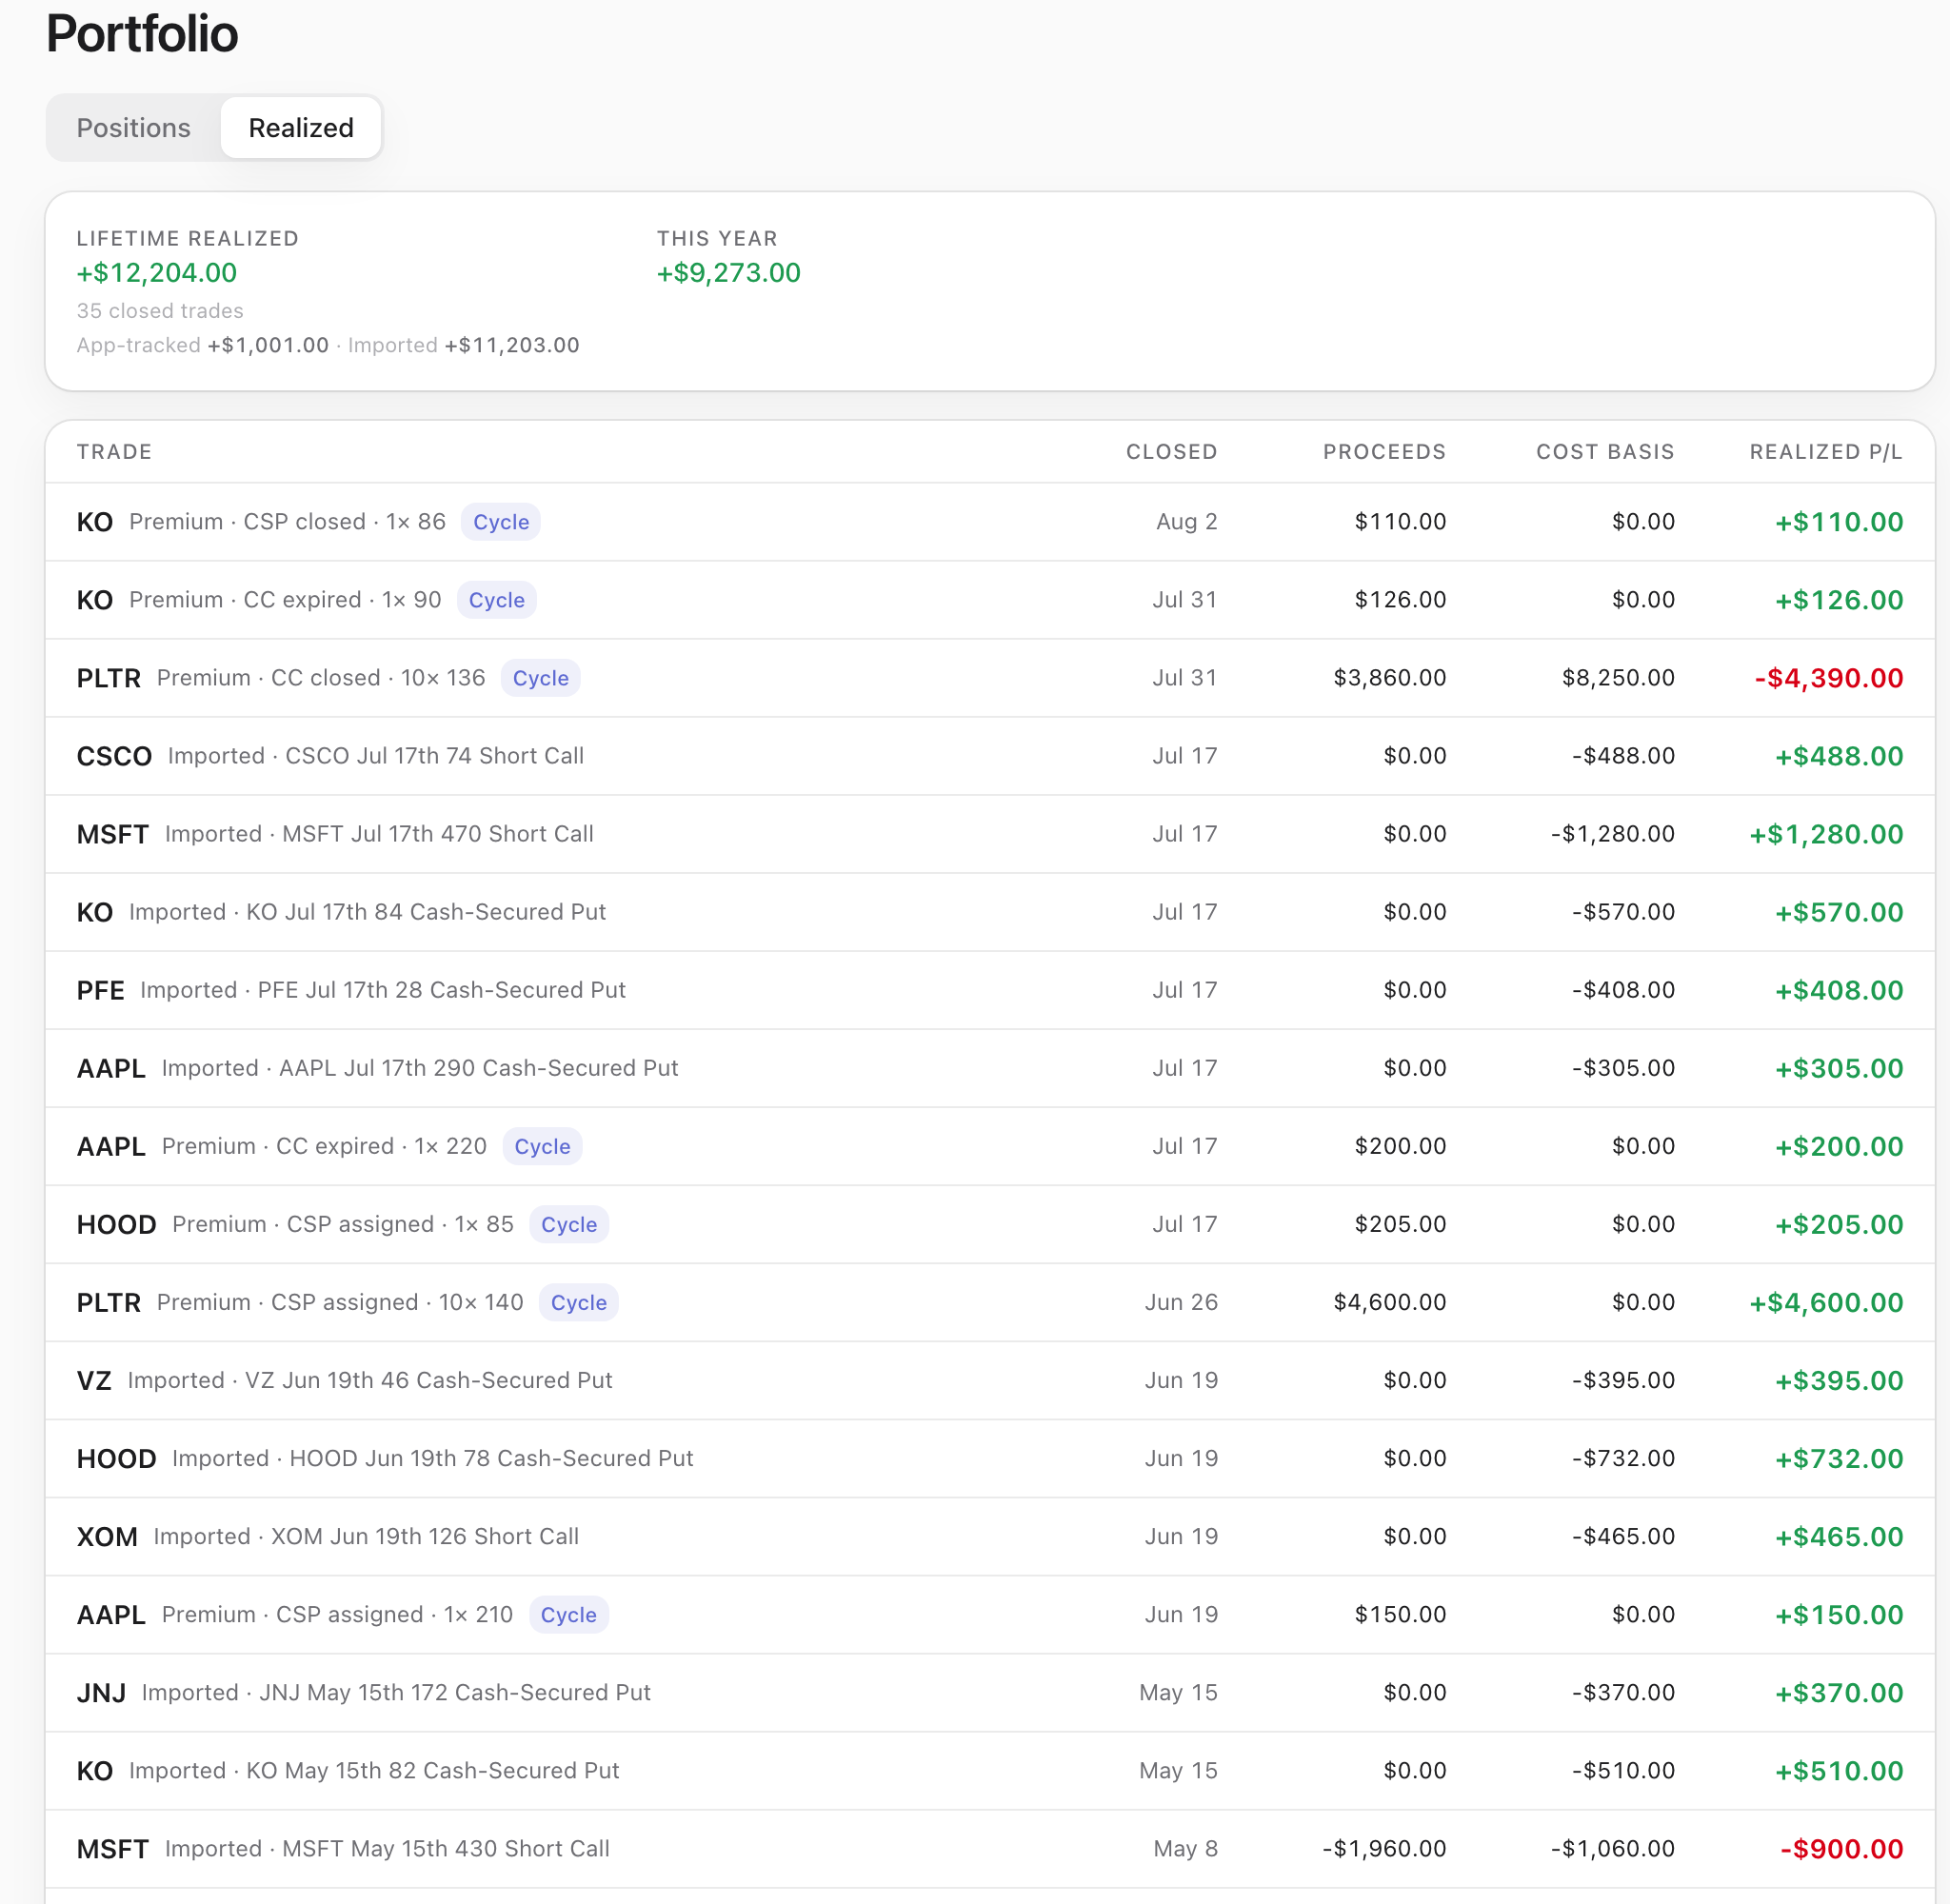
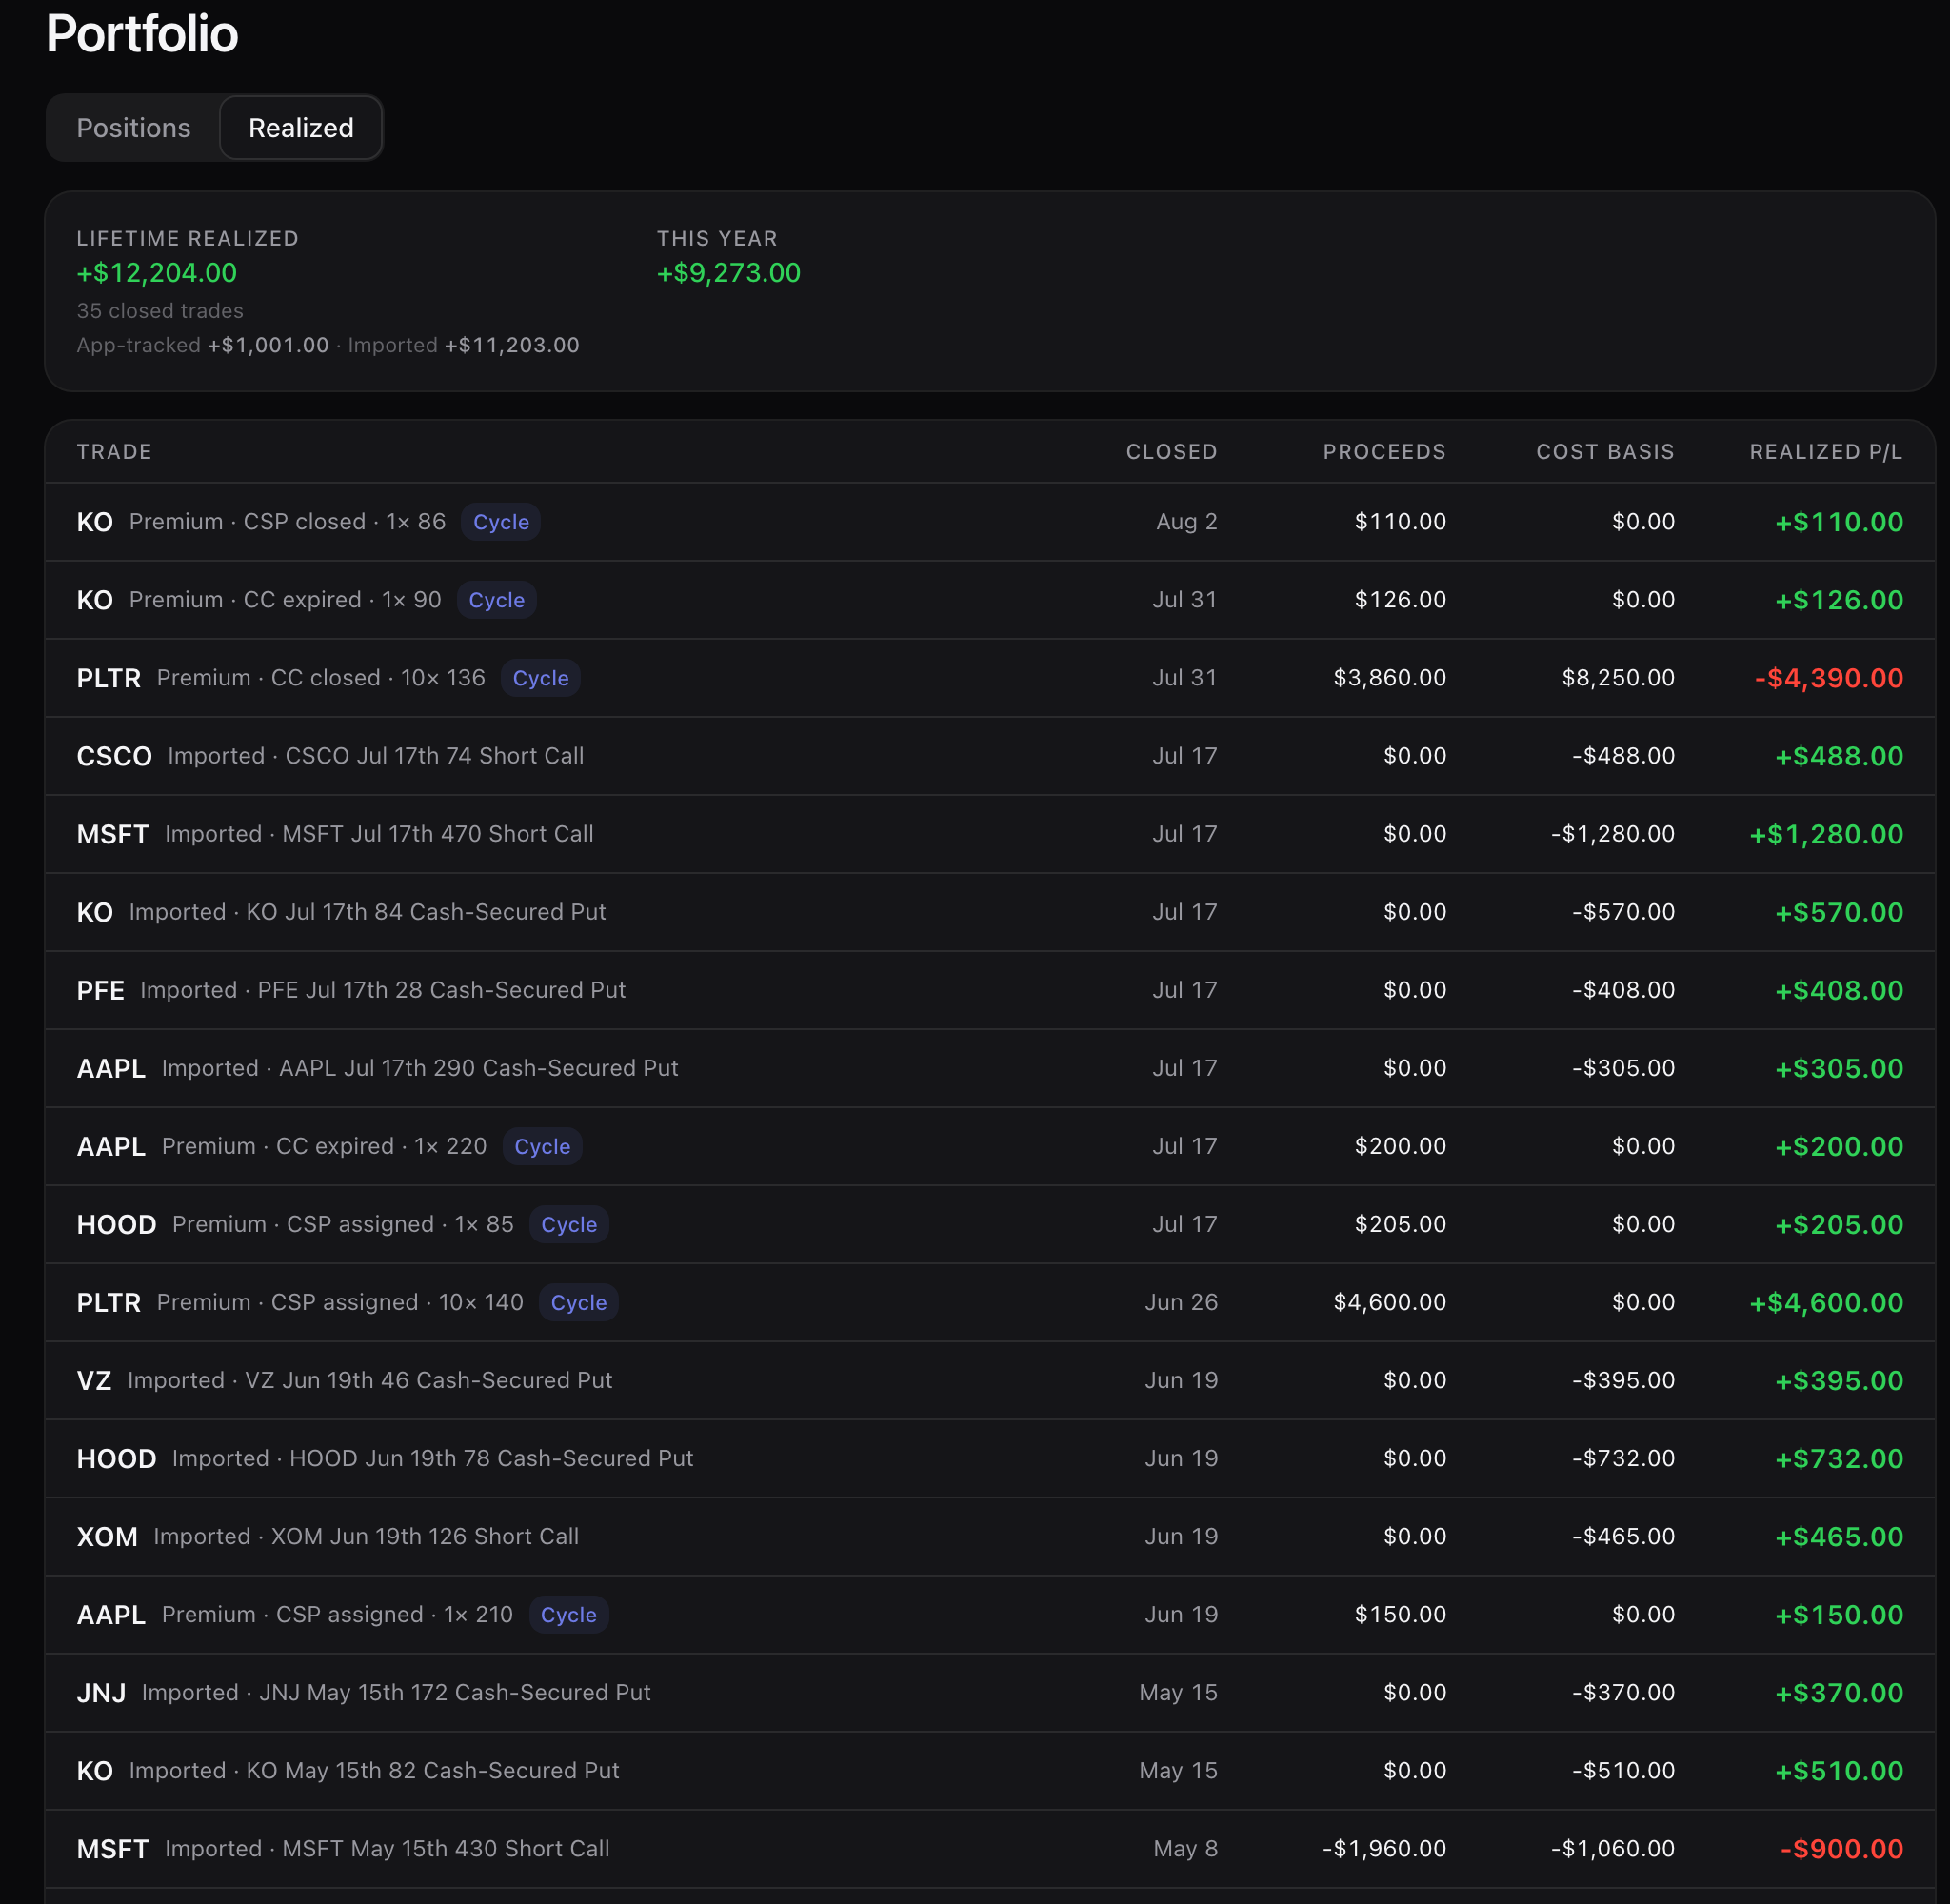
Every lot carries where it came from. The HOOD lot is badged Assignment, dated 17 July, and its Cycle chip is one tap from the campaign that produced it. Closed trades fall into a realized ledger that totals, and keeps what you tracked here separate from what you brought in.
Free account
- Every holding is marked against the real chain and totalled — day P/L and total P/L per row and for the book — and every row opens into the lots underneath it.
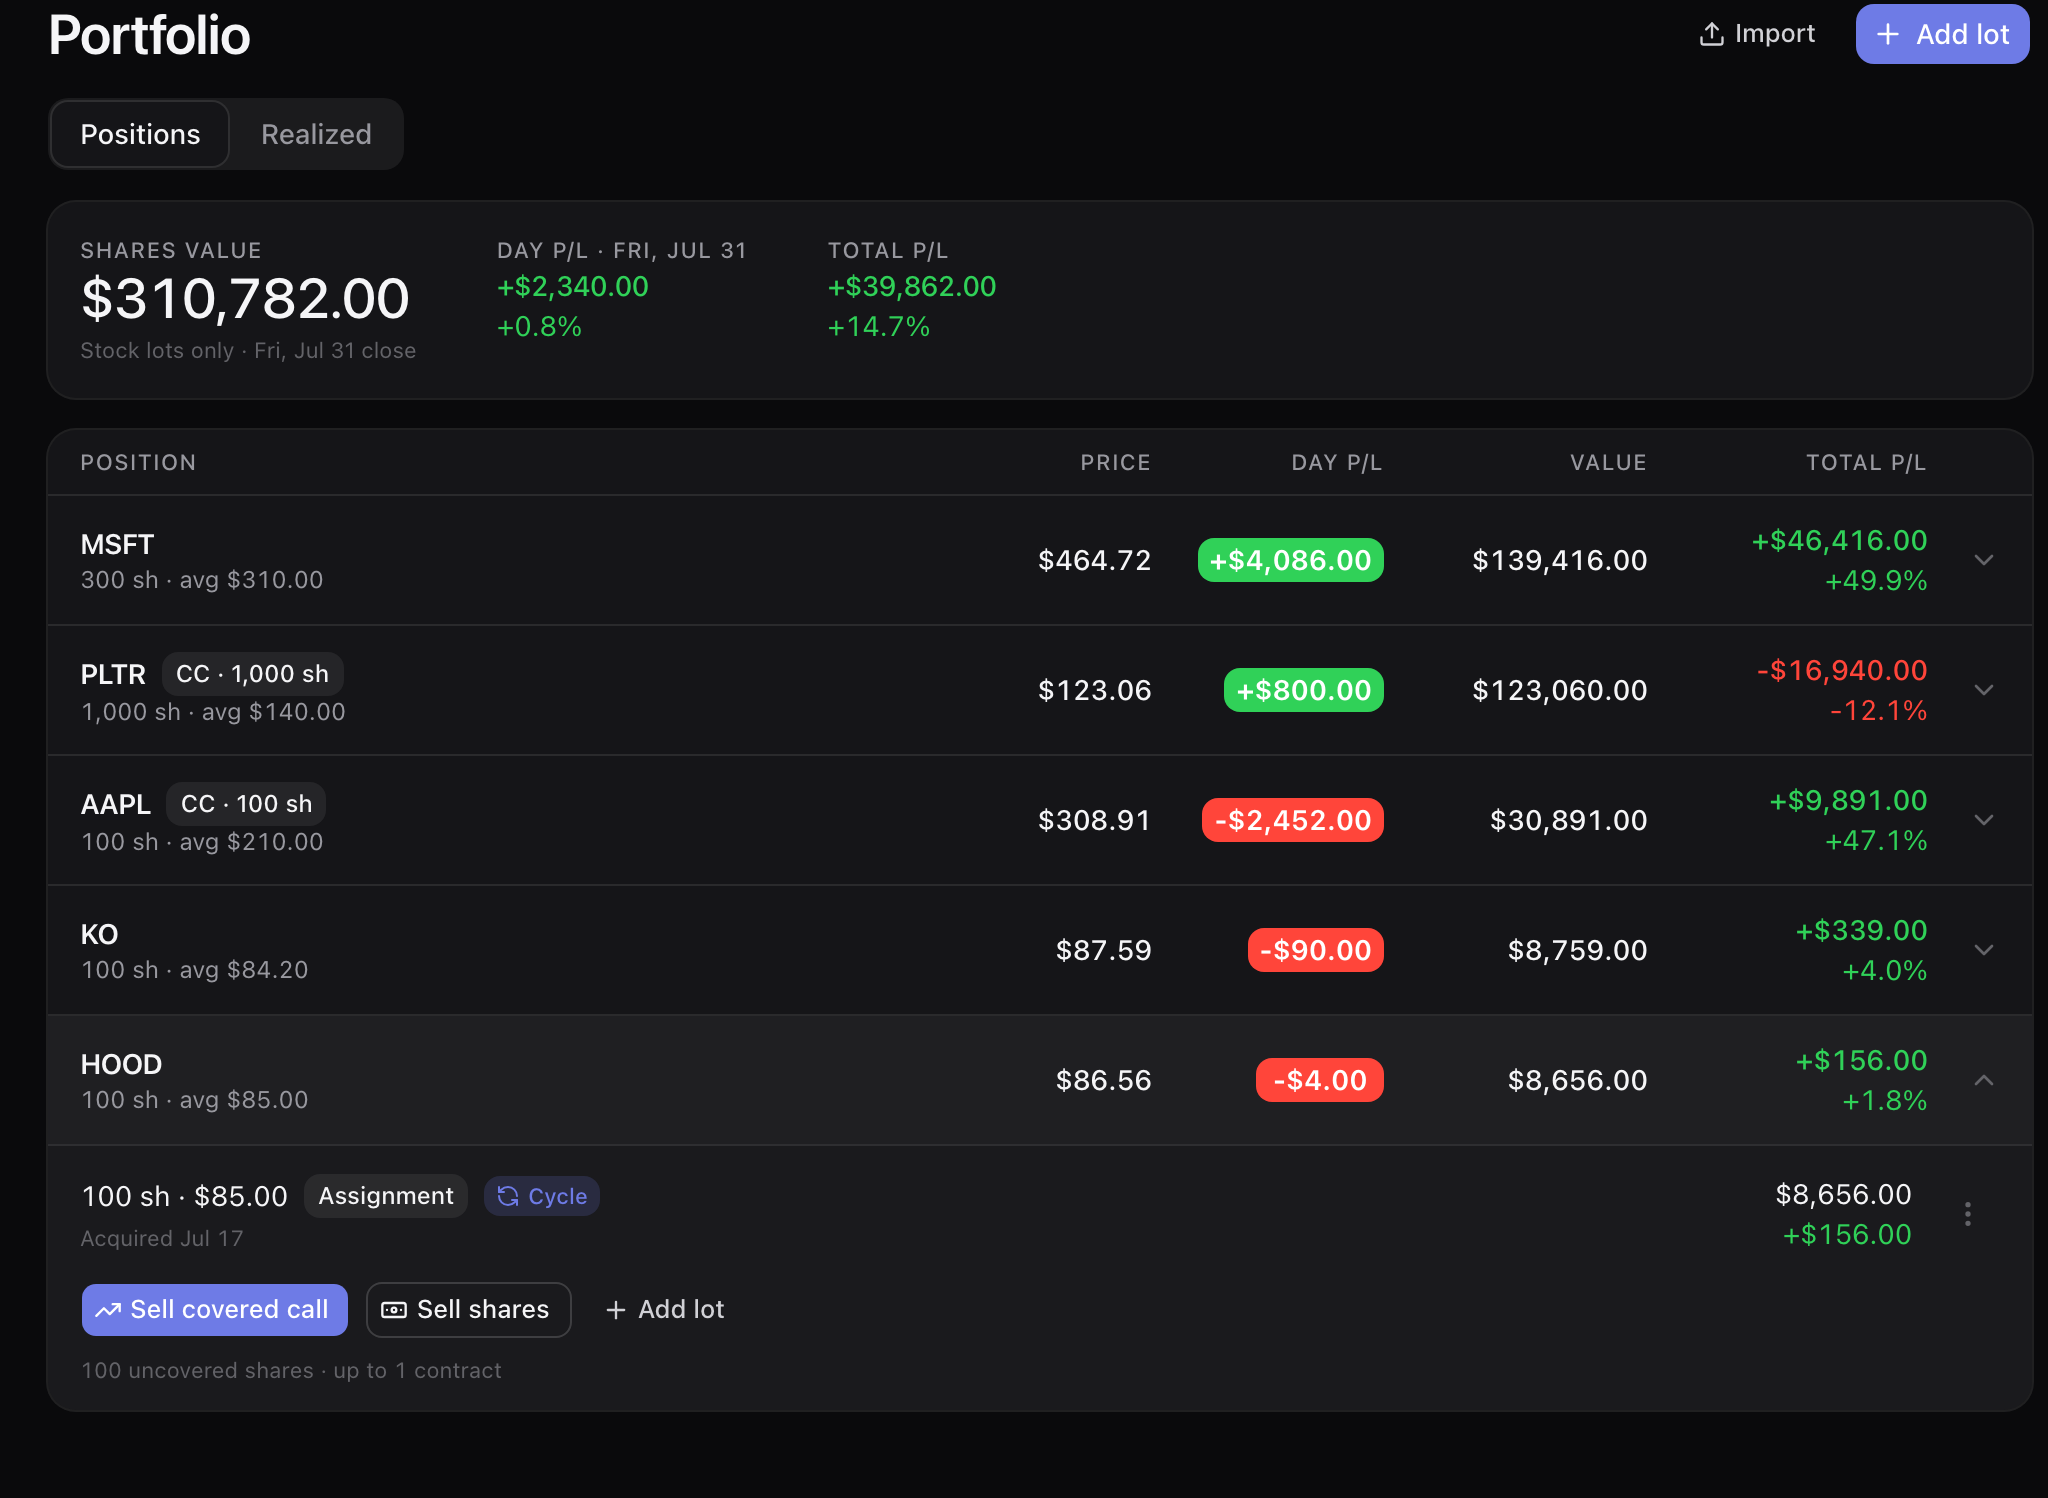
- The HOOD lot: 100 shares at $85.00, acquired 17 July, badged Assignment, linked to the cycle that produced it. Marked at the $86.56 close it is worth $8,656.00 — +$156.00 on the $8,500 the assignment tied up.
- Any holding with 100 uncovered shares offers the covered call from the row itself: the expanded HOOD lot reads “100 uncovered shares · up to 1 contract”, and writing one joins the cycle those shares came from instead of opening a second record over the same stock.
- The realized ledger keeps what you tracked here and what you brought in through the importer on separate lines under the lifetime total, with this year beside it — a single blended number would tell you nothing about either.
- A worthless expiry is a real row, not a rounding: KO cash-secured put closed 2 August — proceeds $110.00, cost basis $0.00, realized +$110.00. A KO covered call that expired reads the same way: proceeds $126.00, cost basis $0.00, realized +$126.00.
- Cycle-linked rows carry a Cycle chip, so a premium line always leads back to the campaign it came from.
Import
Four years of trades are in a spreadsheet, and this month’s positions are in a brokerage app.
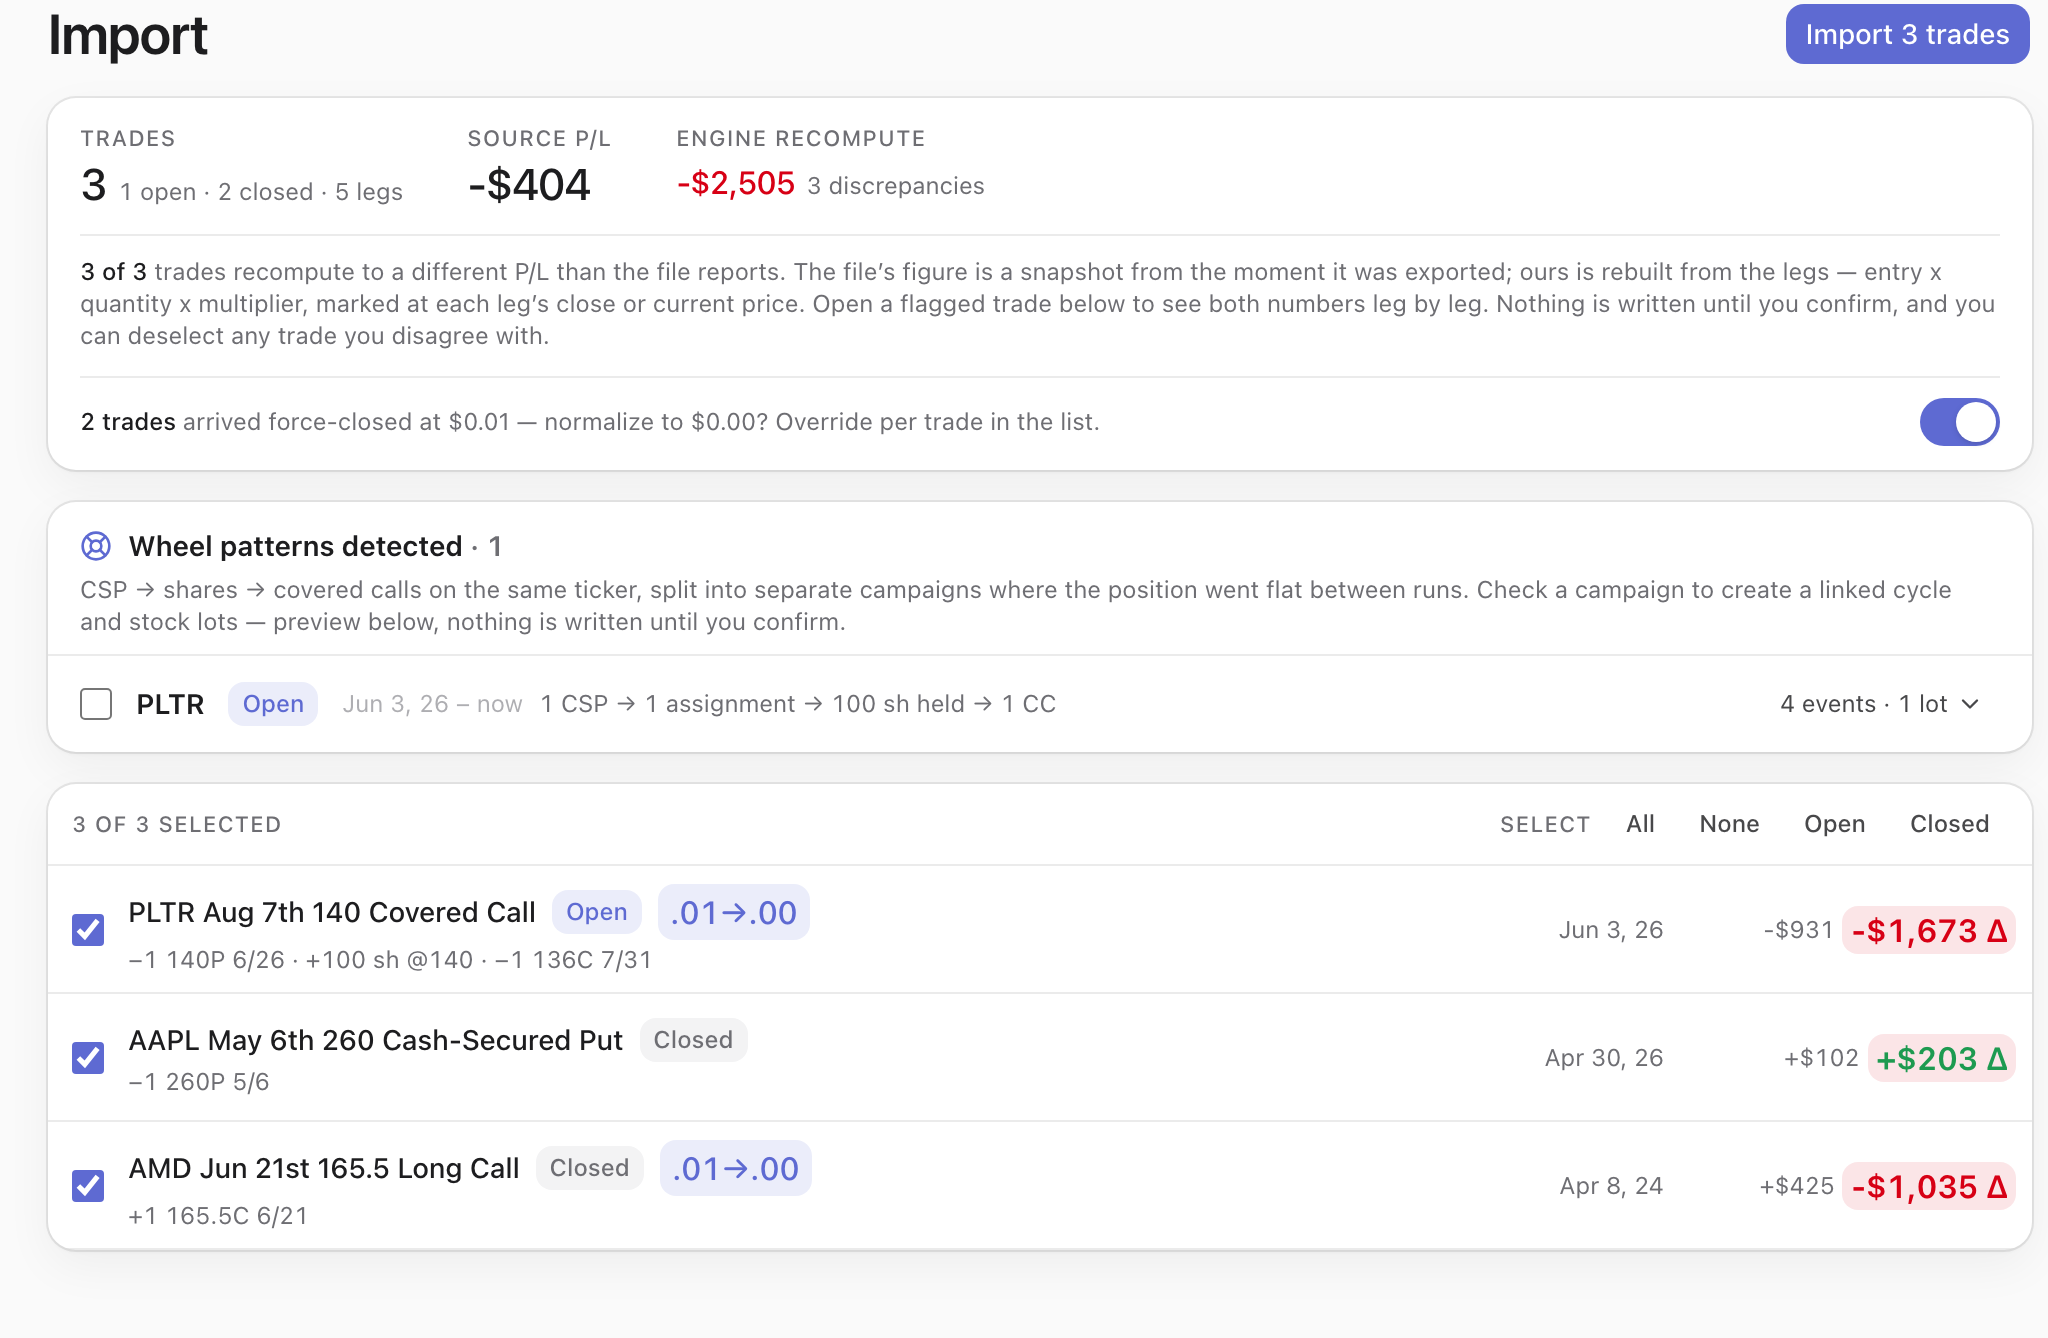
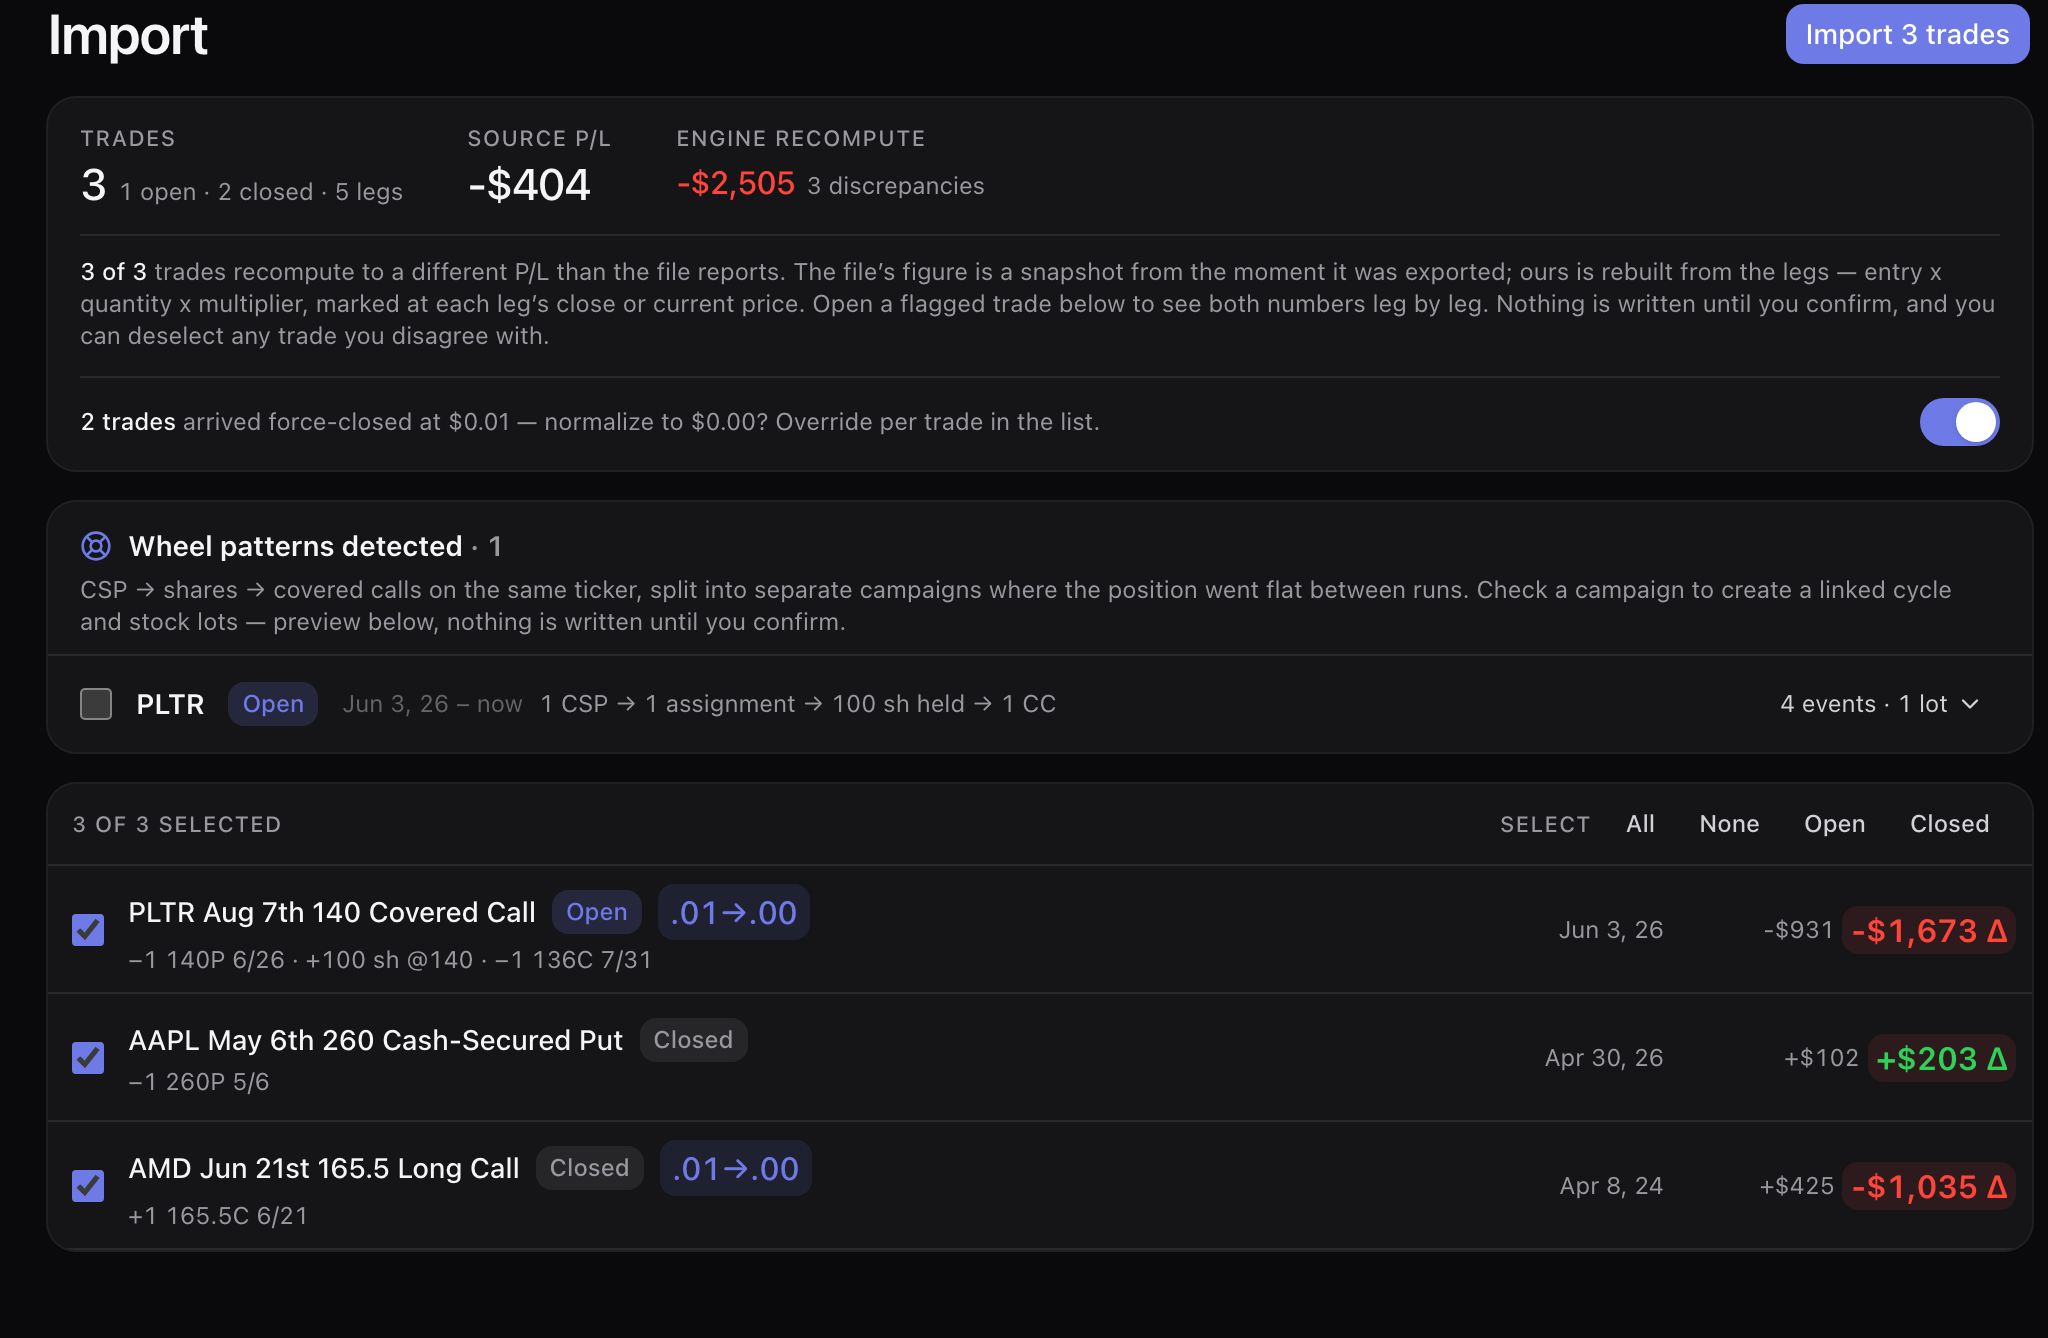
Upload the history file and every trade comes back as a trade — legs, dates, entry and close — with our recompute next to the file’s own number and every gap flagged for you to open. Photograph or screenshot a positions screen for whatever the file cannot cover. Nothing is written until you confirm it.
Free account · screenshot reader is Premium
- A history file that reports −$404 recomputes to −$2,505 leg by leg from entry × quantity × multiplier, and all three differences are flagged rather than quietly adopted — 3 trades, 1 open and 2 closed, 5 legs, every one of them opened up beside the source’s own number.
- 2 of those trades arrived force-closed at $0.01. One toggle normalizes them to $0.00, and you can override per trade if you genuinely did pay a penny to get out.
- Wheel campaigns are reassembled, not scattered: 1 put → 1 assignment → 100 shares held → 1 covered call becomes one linked cycle with its stock lot and 4 events.
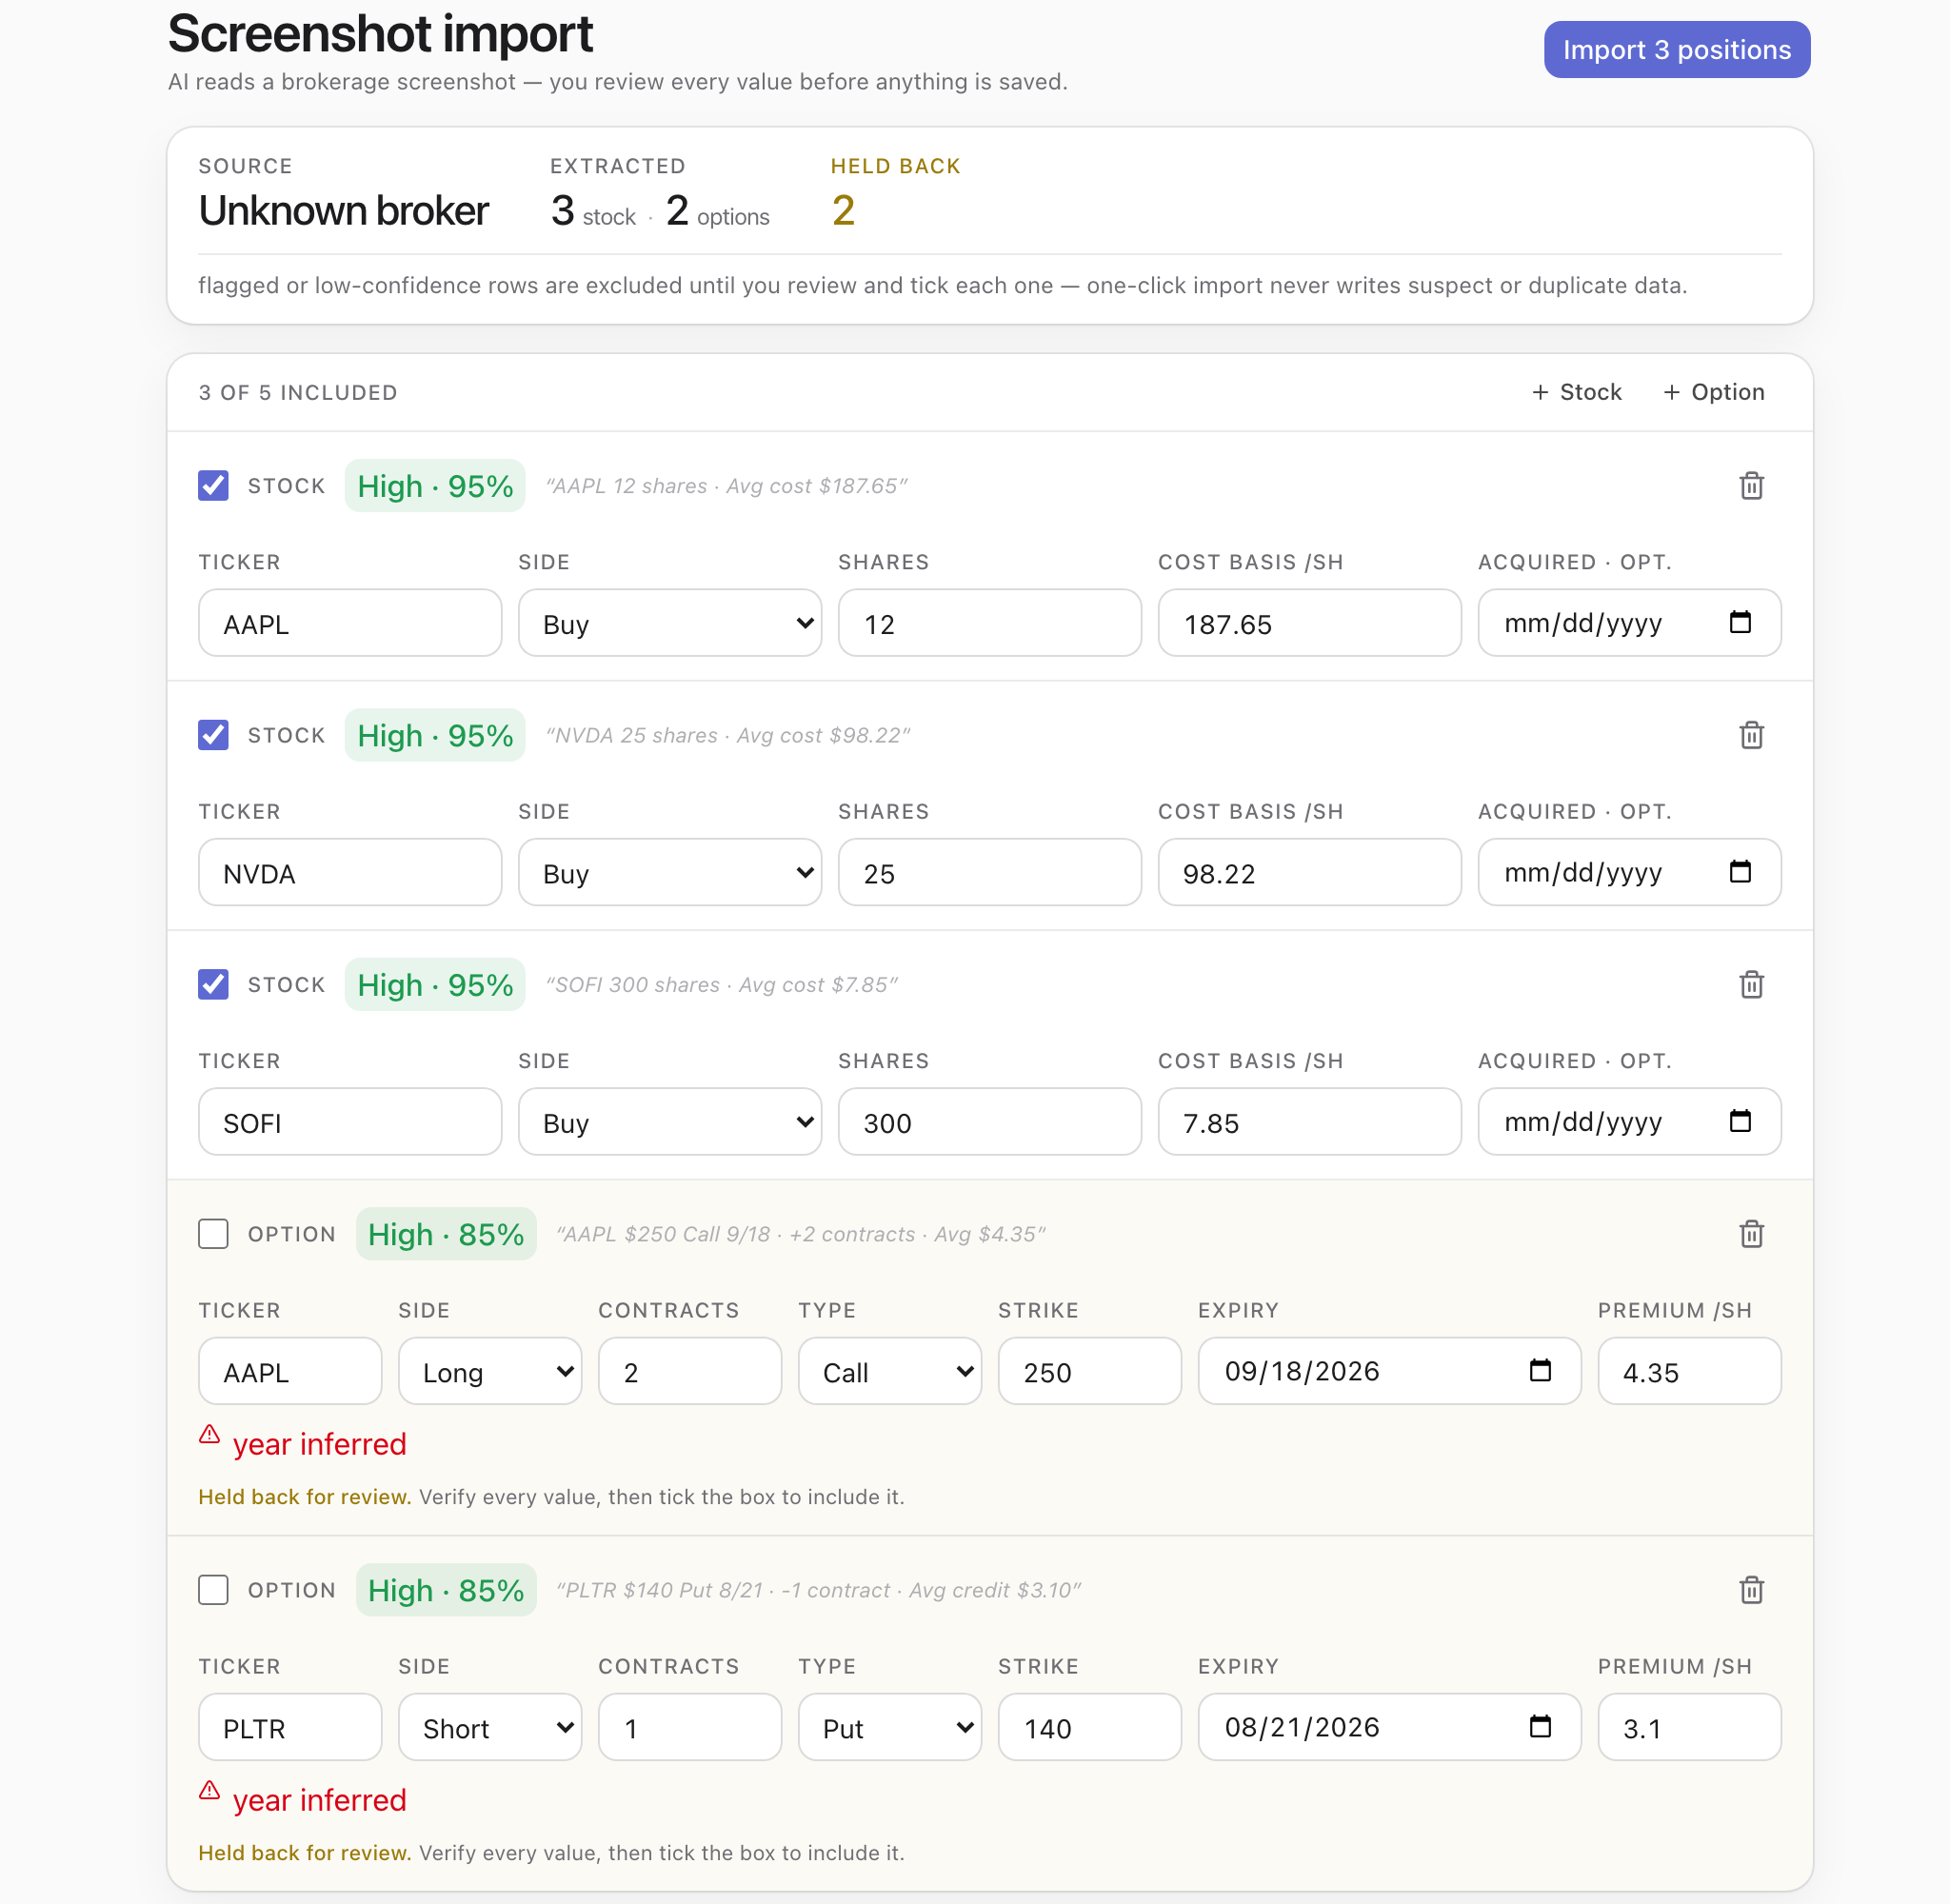
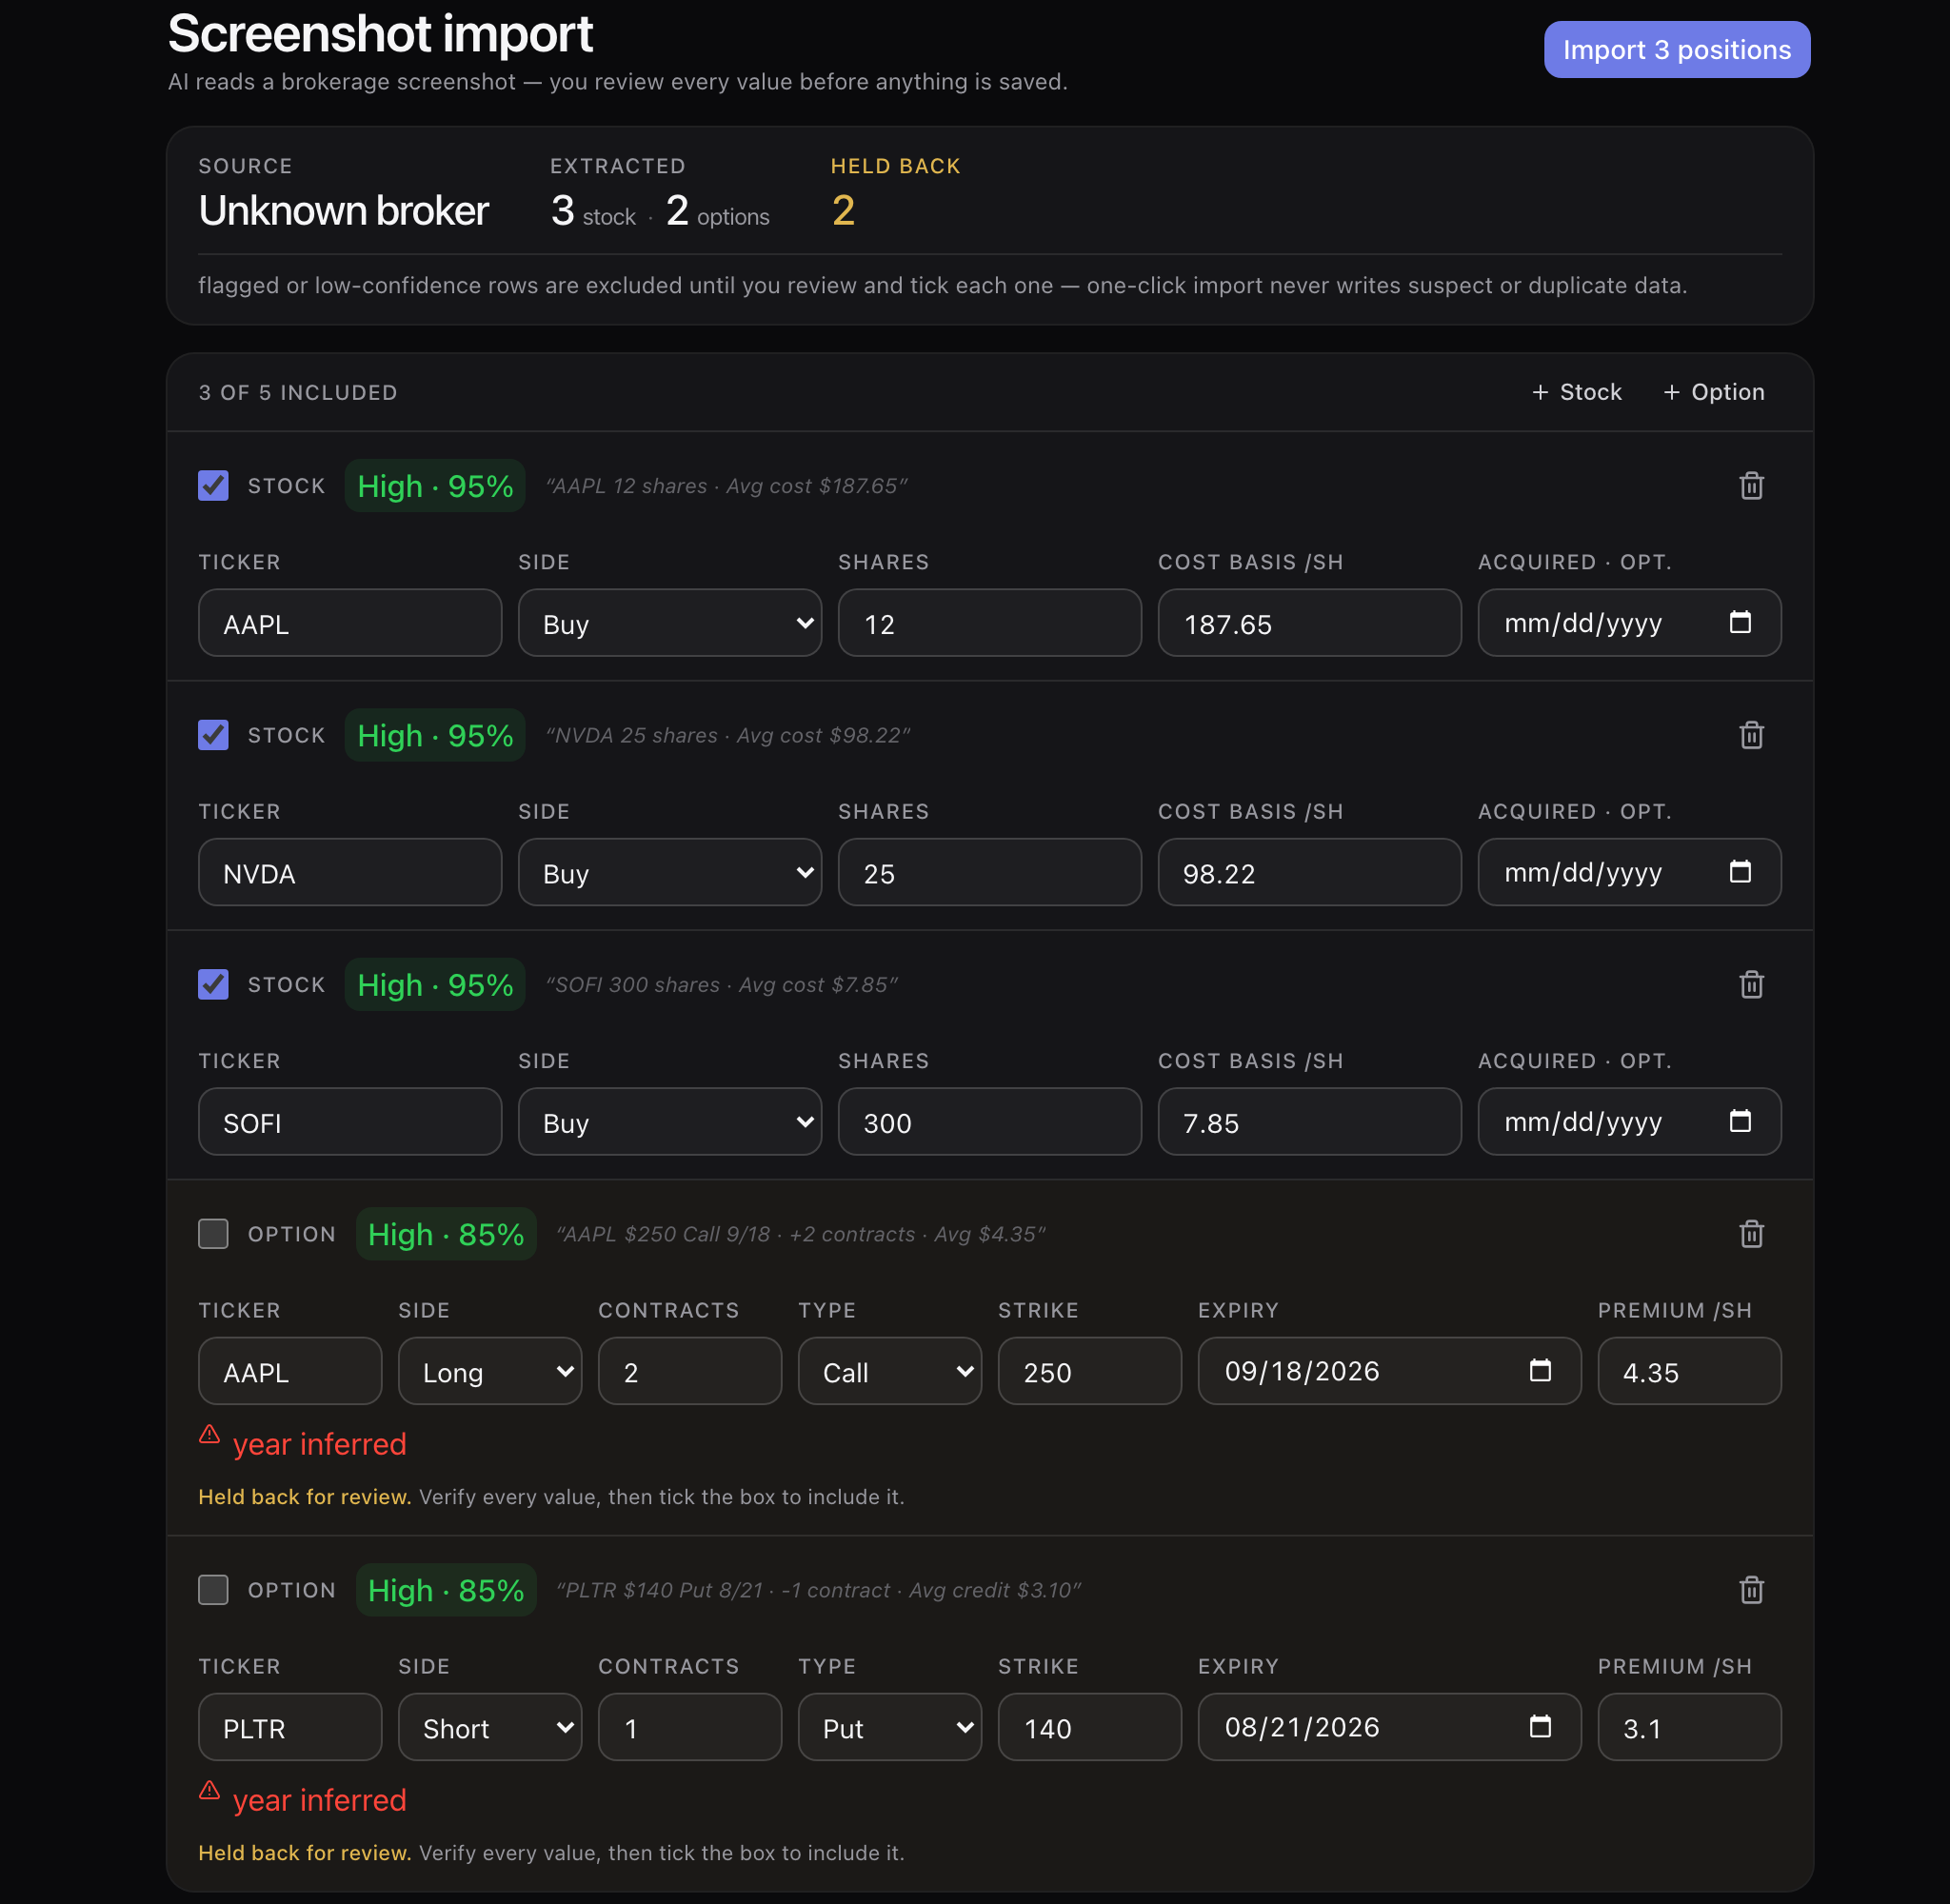
- Screenshot path: 5 positions read off a brokerage screen — AAPL 12 shares at $187.65, NVDA 25 at $98.22, SOFI 300 at $7.85, each at 95% confidence.
- The 2 option rows where the expiry year had to be inferred are held back and unticked until you check them; the import button says “Import 3 positions”, not 5.
- File import is free and stays free — getting your history in should not have a price. The screenshot reader comes with Premium.
AI copilot
“Sell me a 30-delta cash-secured put on KO, about 30 days out.”
Type that with no account and no session and you get real legs off the real chain: KO at $87.59, sell one $85 put expiring 4 September at $1.08 — $108 credit, $8,392 at risk, a 75% chance of profit — plus a builder URL to keep working in. Building and quoting are free. Premium is the copilot working on your own book.
No account to build · your own book is Premium
- Free, anonymous included: ticker search, quotes, the chain, all 58 templates, analysis of the legs already on your screen, and how-do-I answers that walk you to the right screen instead of describing it.
- Premium: reading your own book — saved strategies, portfolio, wheel cycles, watchlists, alerts. “What’s my adjusted basis on PLTR?” answers $130.54 against the $140 assignment.
- Premium: writing to it — logging an assignment, closing a leg, costing the next roll — and the brokerage-screenshot reader.
- Premium also lifts the 3-saved-strategy cap. Premium is $29 a month or $290 a year, coming soon. Everything else here — the builder, the chains, the trackers, the optimizer, the file importer — costs $0.
- Every write is a preview you approve first, and the tool calls stay on screen so you can see which of your tables it read before it answered.
- At the paid boundary it says so in one line — “I can build it; saving and tracking it with me is Premium” — and hands back the working builder URL with it, so the trade you asked for still arrives.
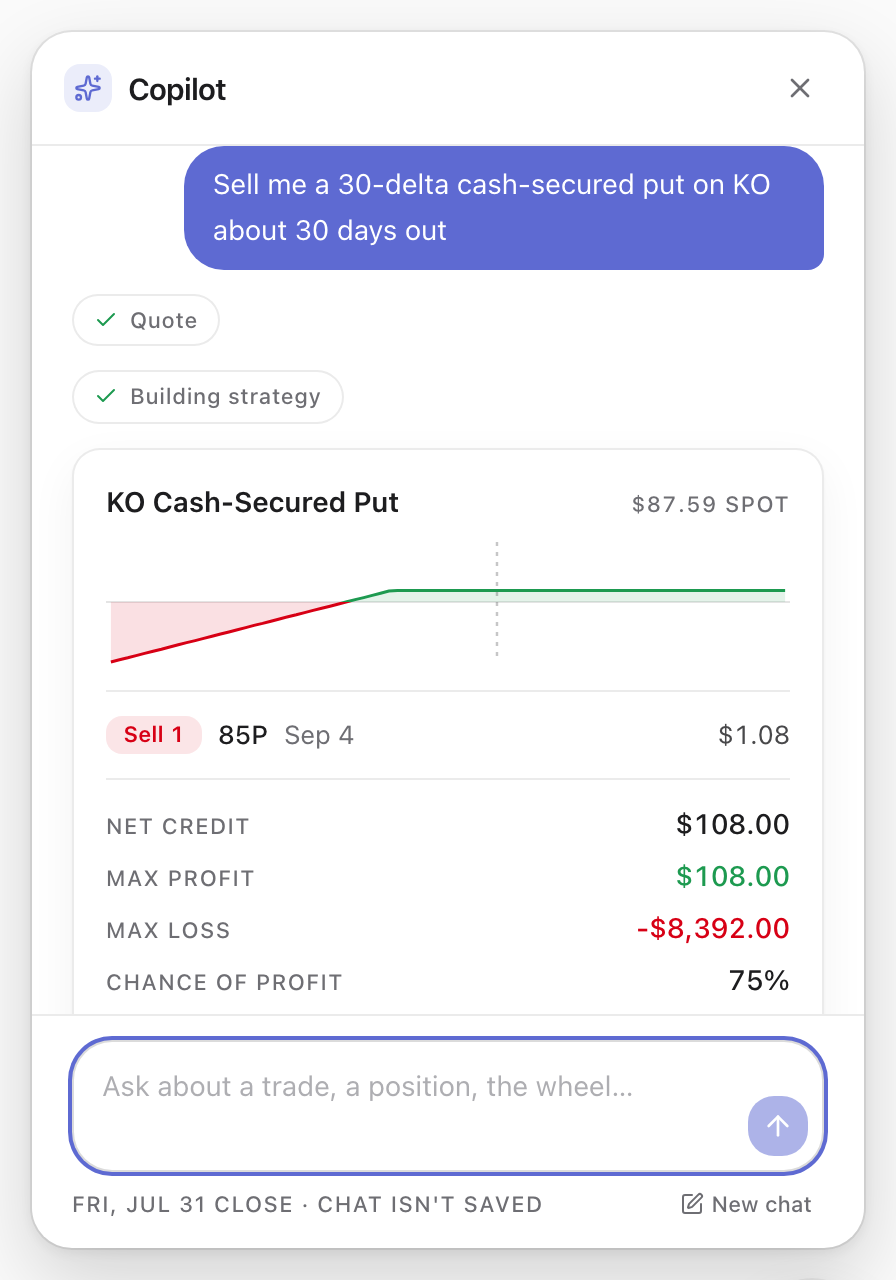
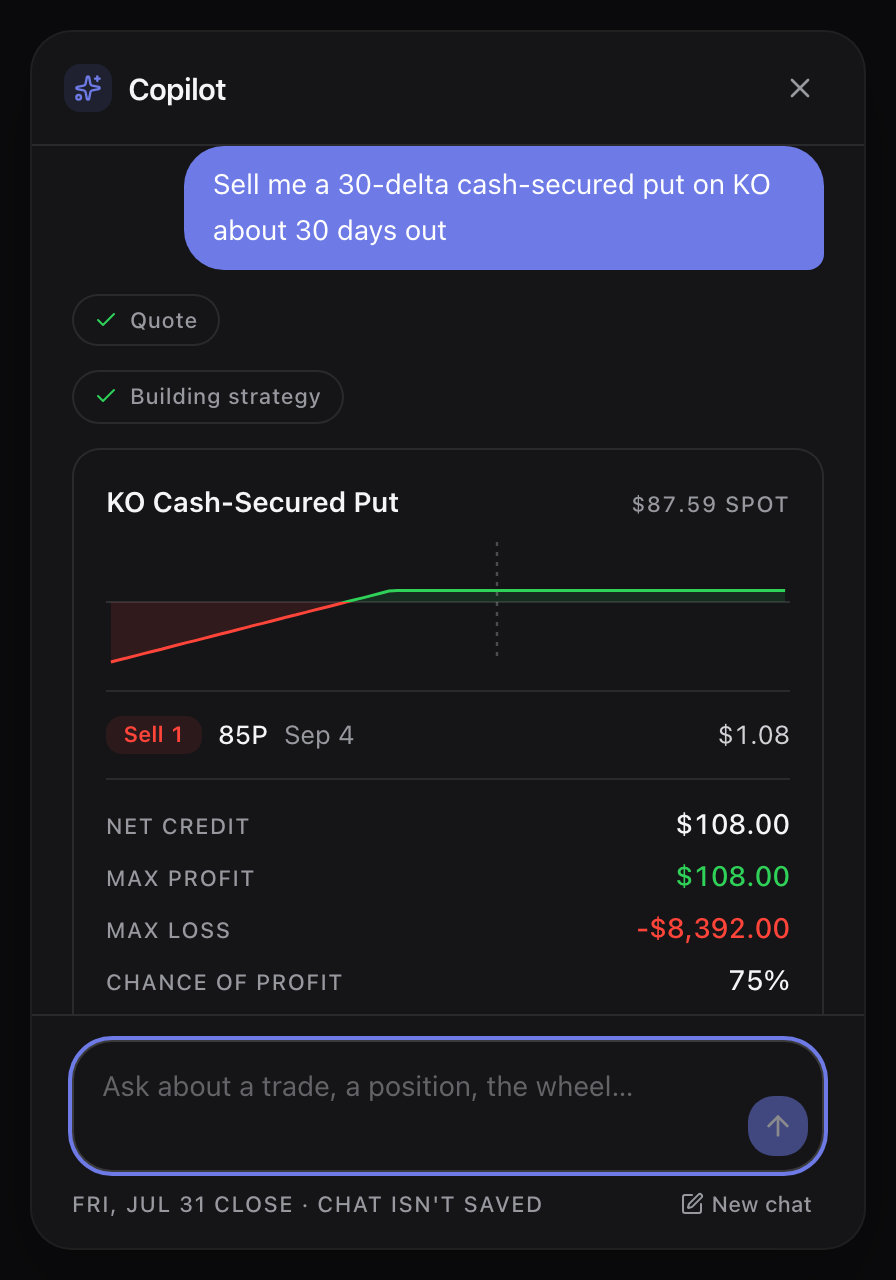
That turn ran with no session at all: no email, no account, no card. It is the same copilot that answers “how do I log an assignment?” and then opens the screen for you. The line it will not cross without Premium is your own book — it will build the trade all day, but saving it, closing it and tracking it with you is the paid part, and it says so in one sentence rather than failing silently.
Watchlists
Before you write a call over September, you need the ex-dividend date.
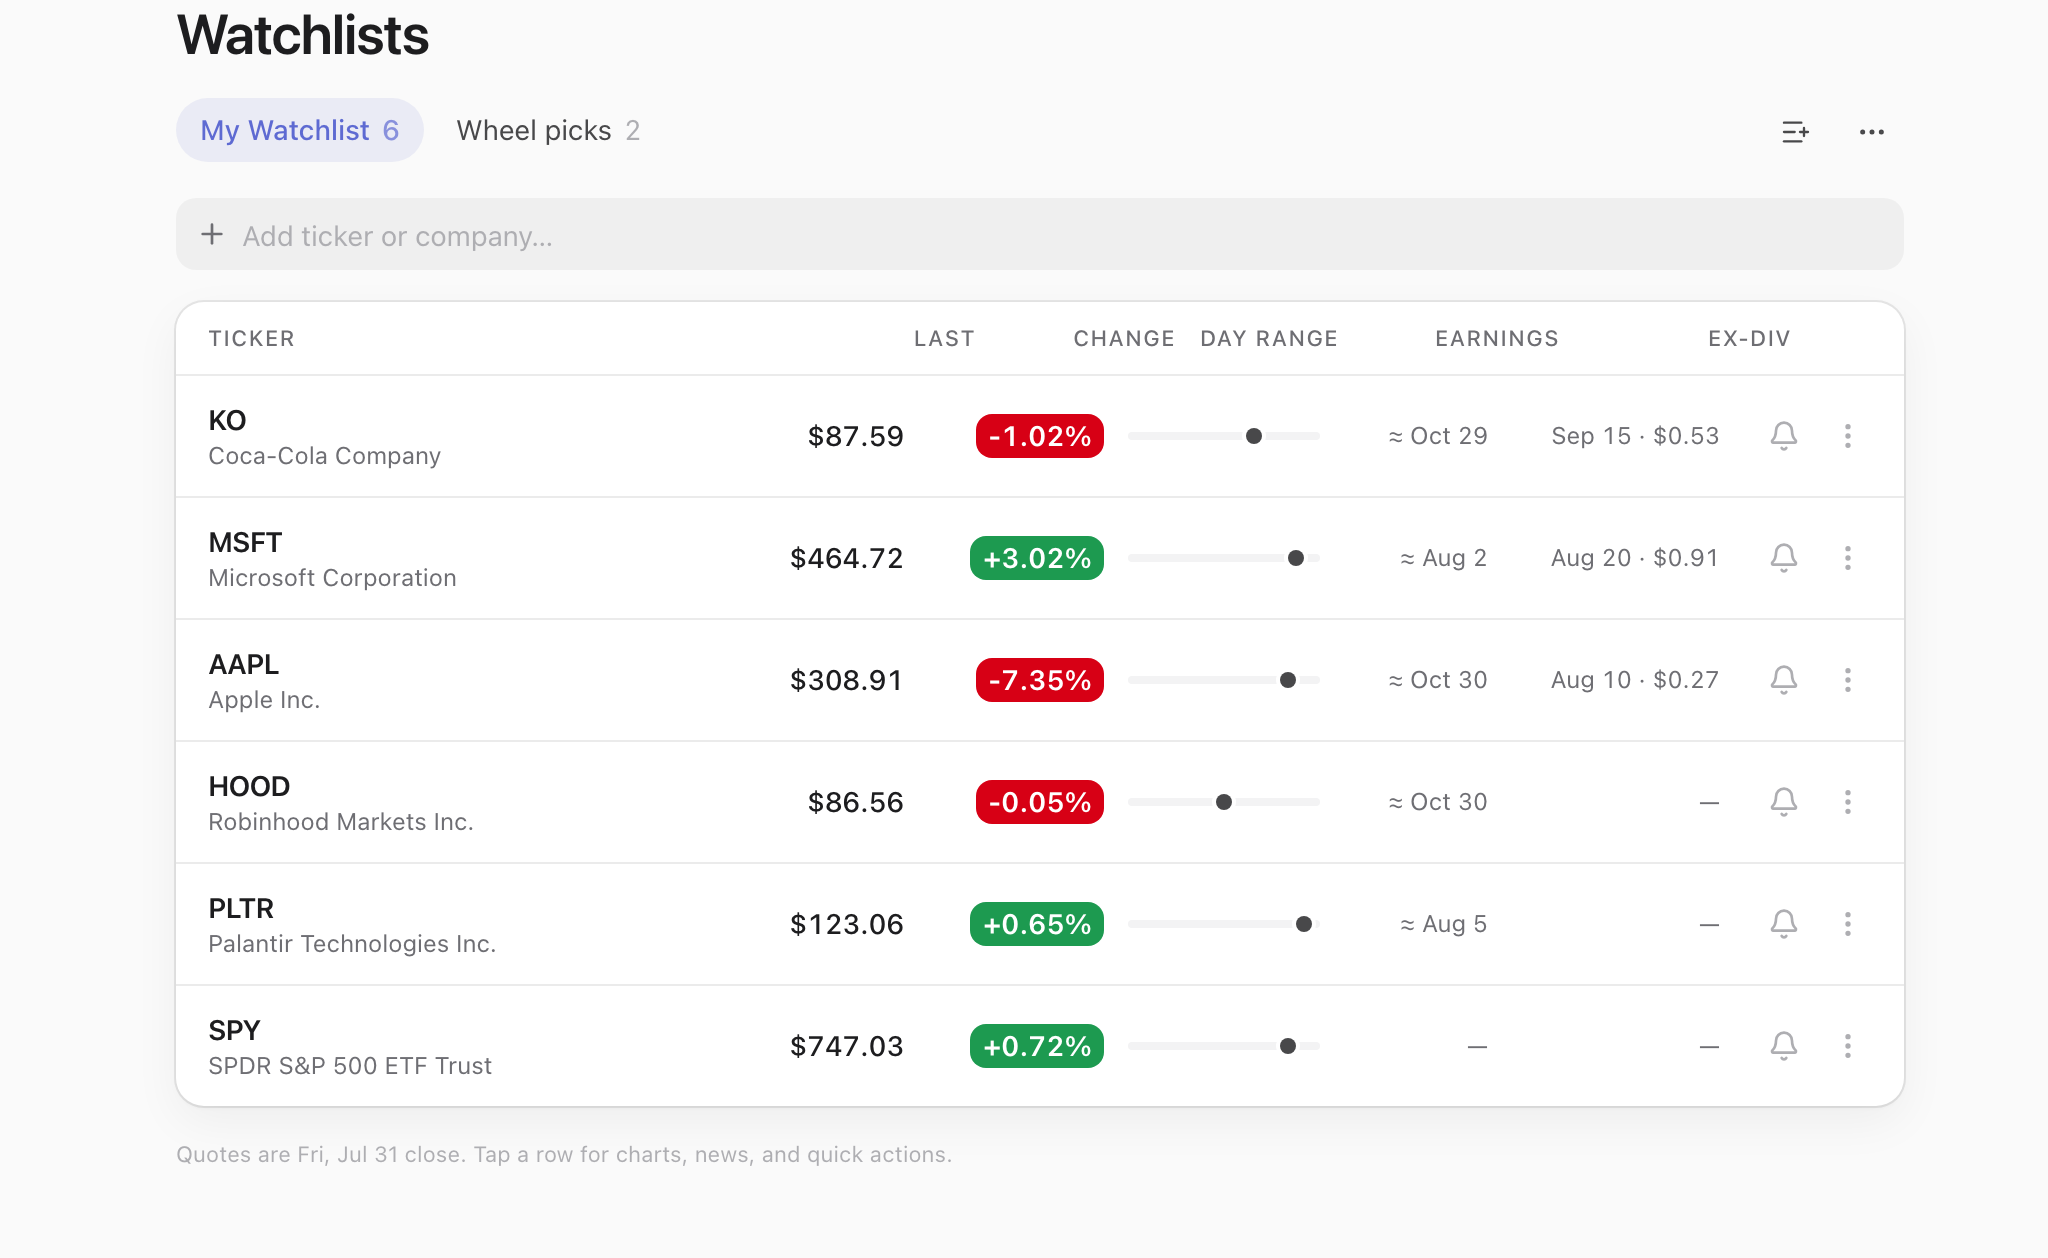
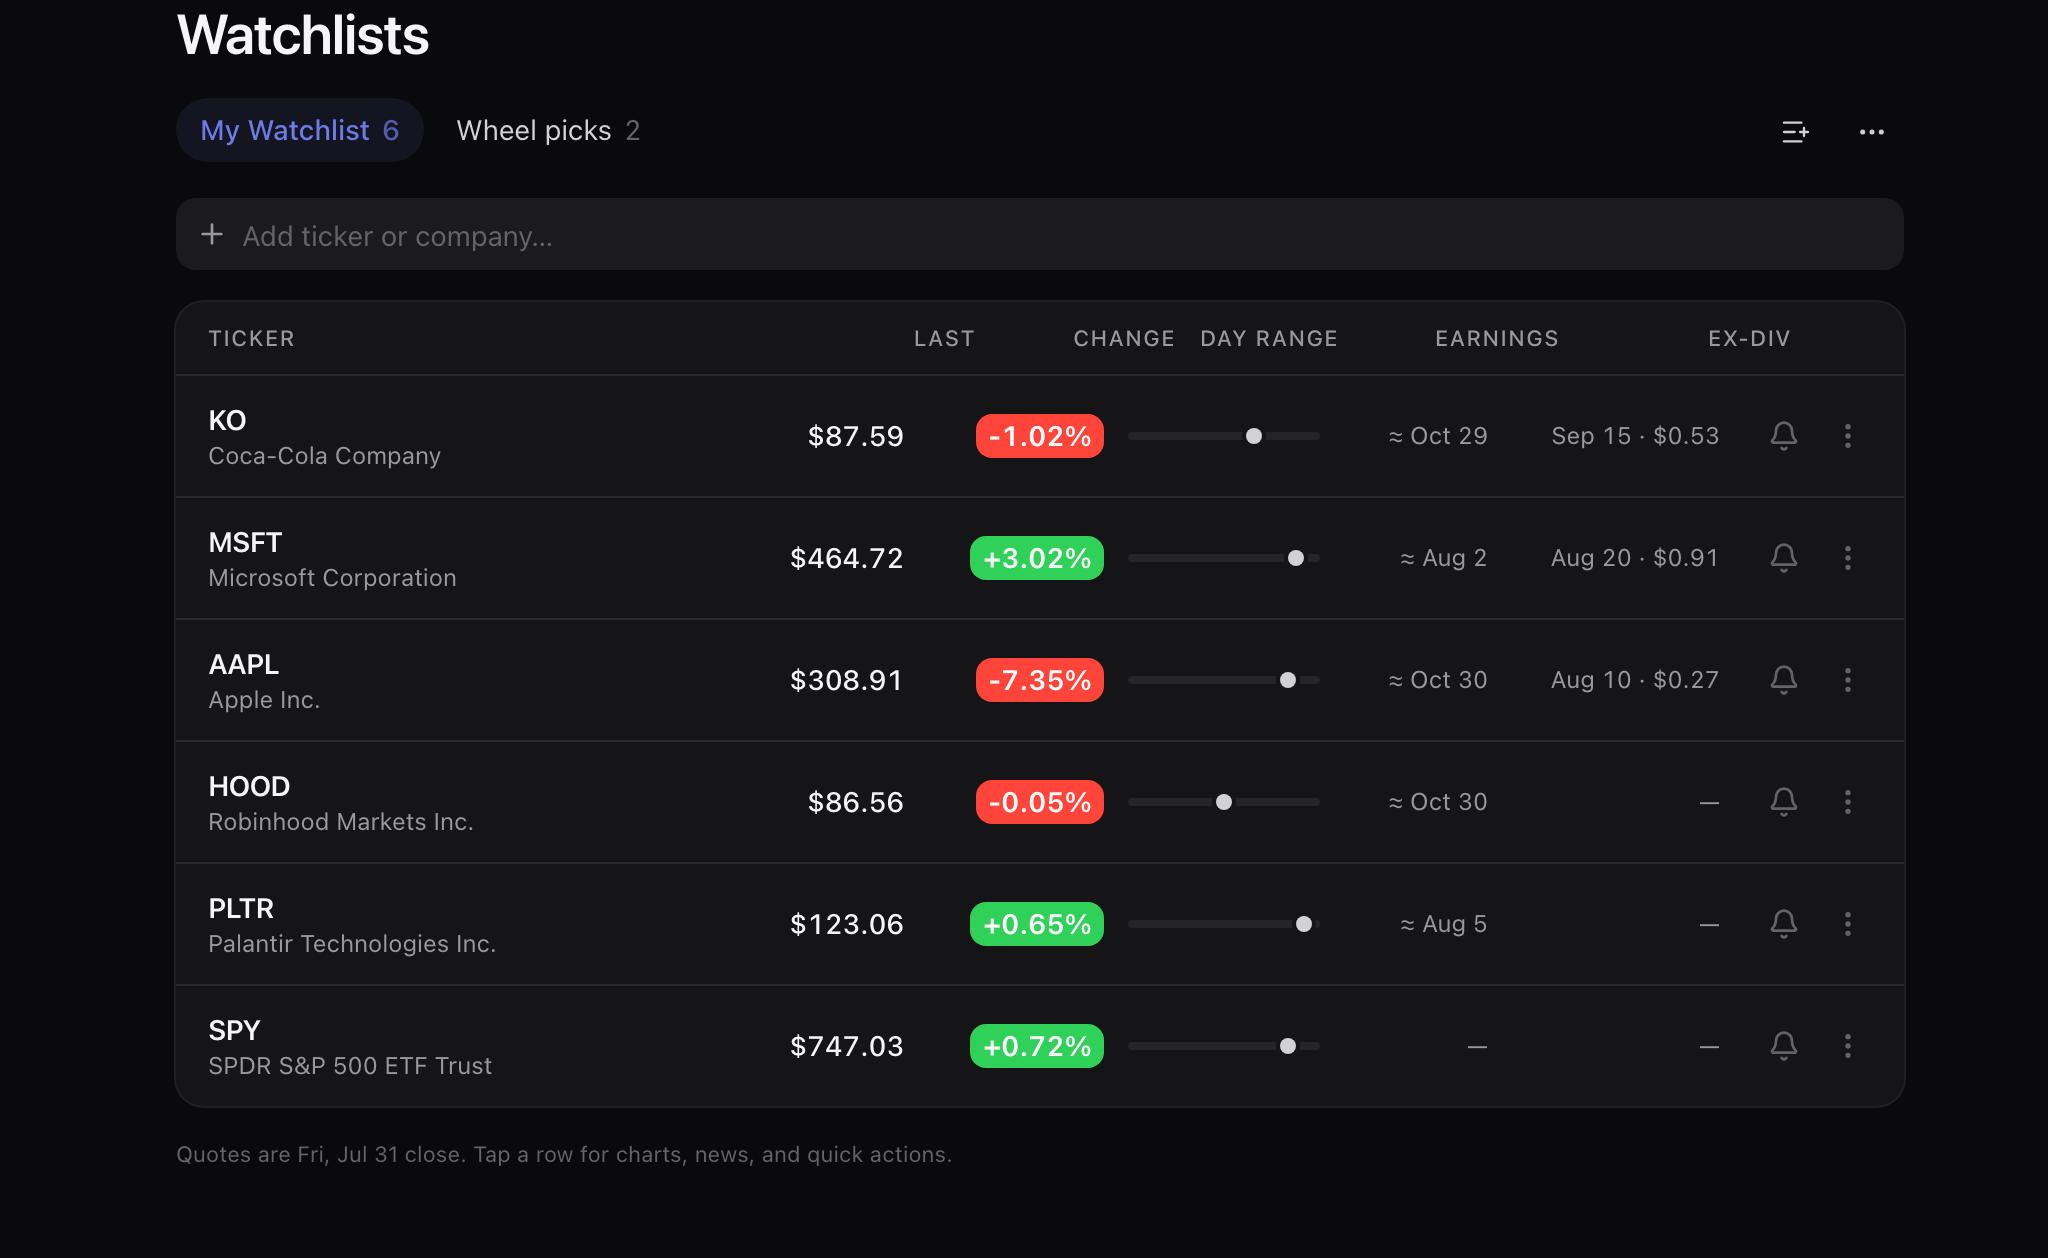
A watchlist row carries what a premium seller acts on rather than what a chart looks like: last price, the day’s change and range, the next earnings date and the next ex-dividend date with the amount attached.
Free account
- KO $87.59, −1.02%, earnings around 29 October, ex-dividend 15 September at $0.53 — the two dates that decide whether a September call gets exercised early.
- MSFT $464.72, +3.02%, ex-dividend 20 August at $0.91. AAPL $308.91, −7.35%, ex-dividend 10 August at $0.27.
- Separate lists: the six names you watch and the two you actually wheel do not have to share a screen.
- Set a price alert straight from the row, or open the ticker for charts, news and a build.
- Every quote is stamped — 15 minutes delayed while the market is open, the previous close when it is shut.
Alerts
You are short a put into September, and you have not checked when the company reports.
Four kinds, all read off the same data the builder prices from: a price level, a P/L percentage on a position you hold, an earnings date on a ticker you name, and an ex-dividend date on one. Each is checked every minute the market is open, and each records the print or the date that tripped it, so what fired and when is a record rather than a notification you swiped away.
Free account
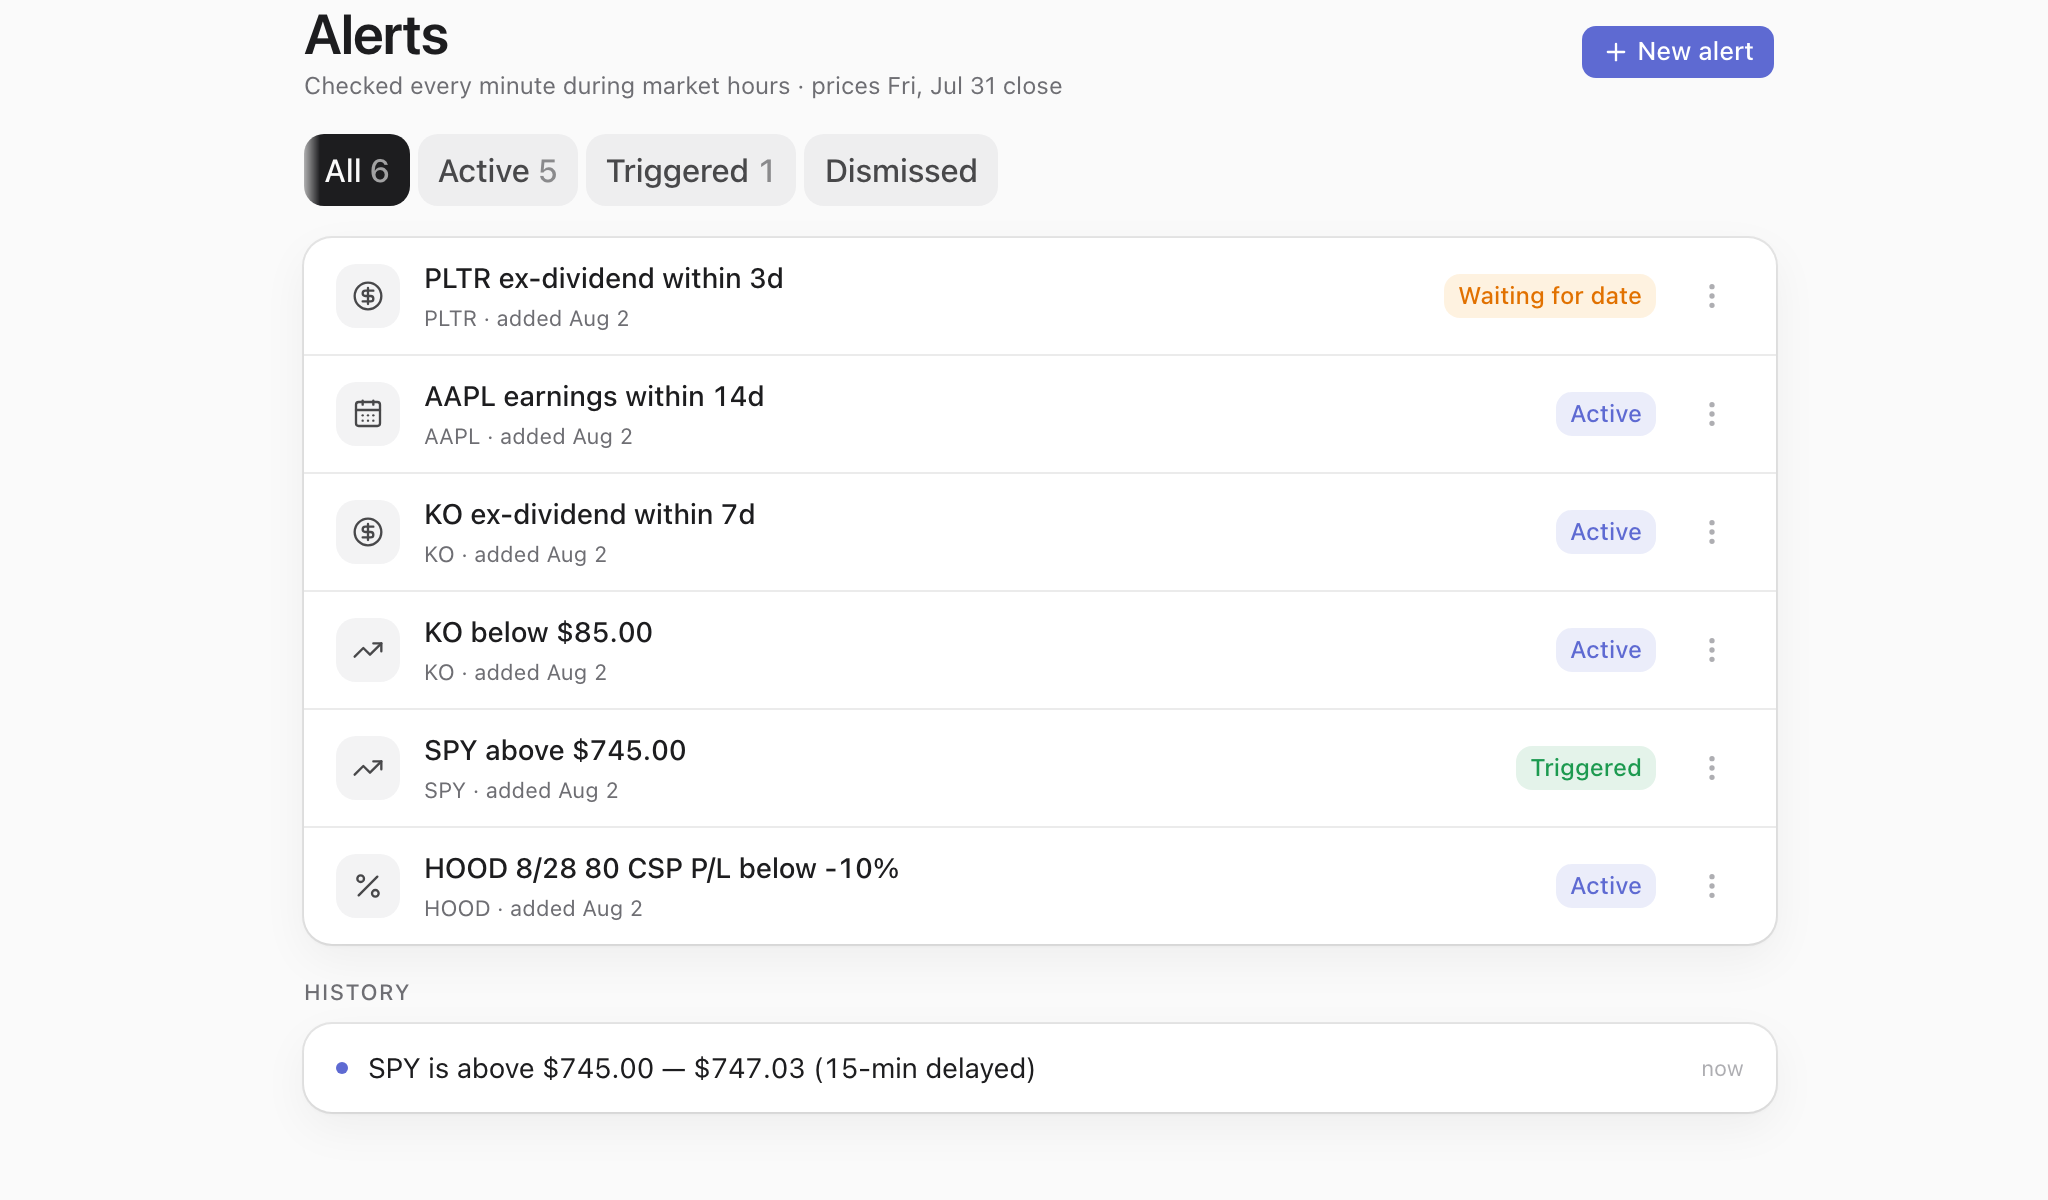
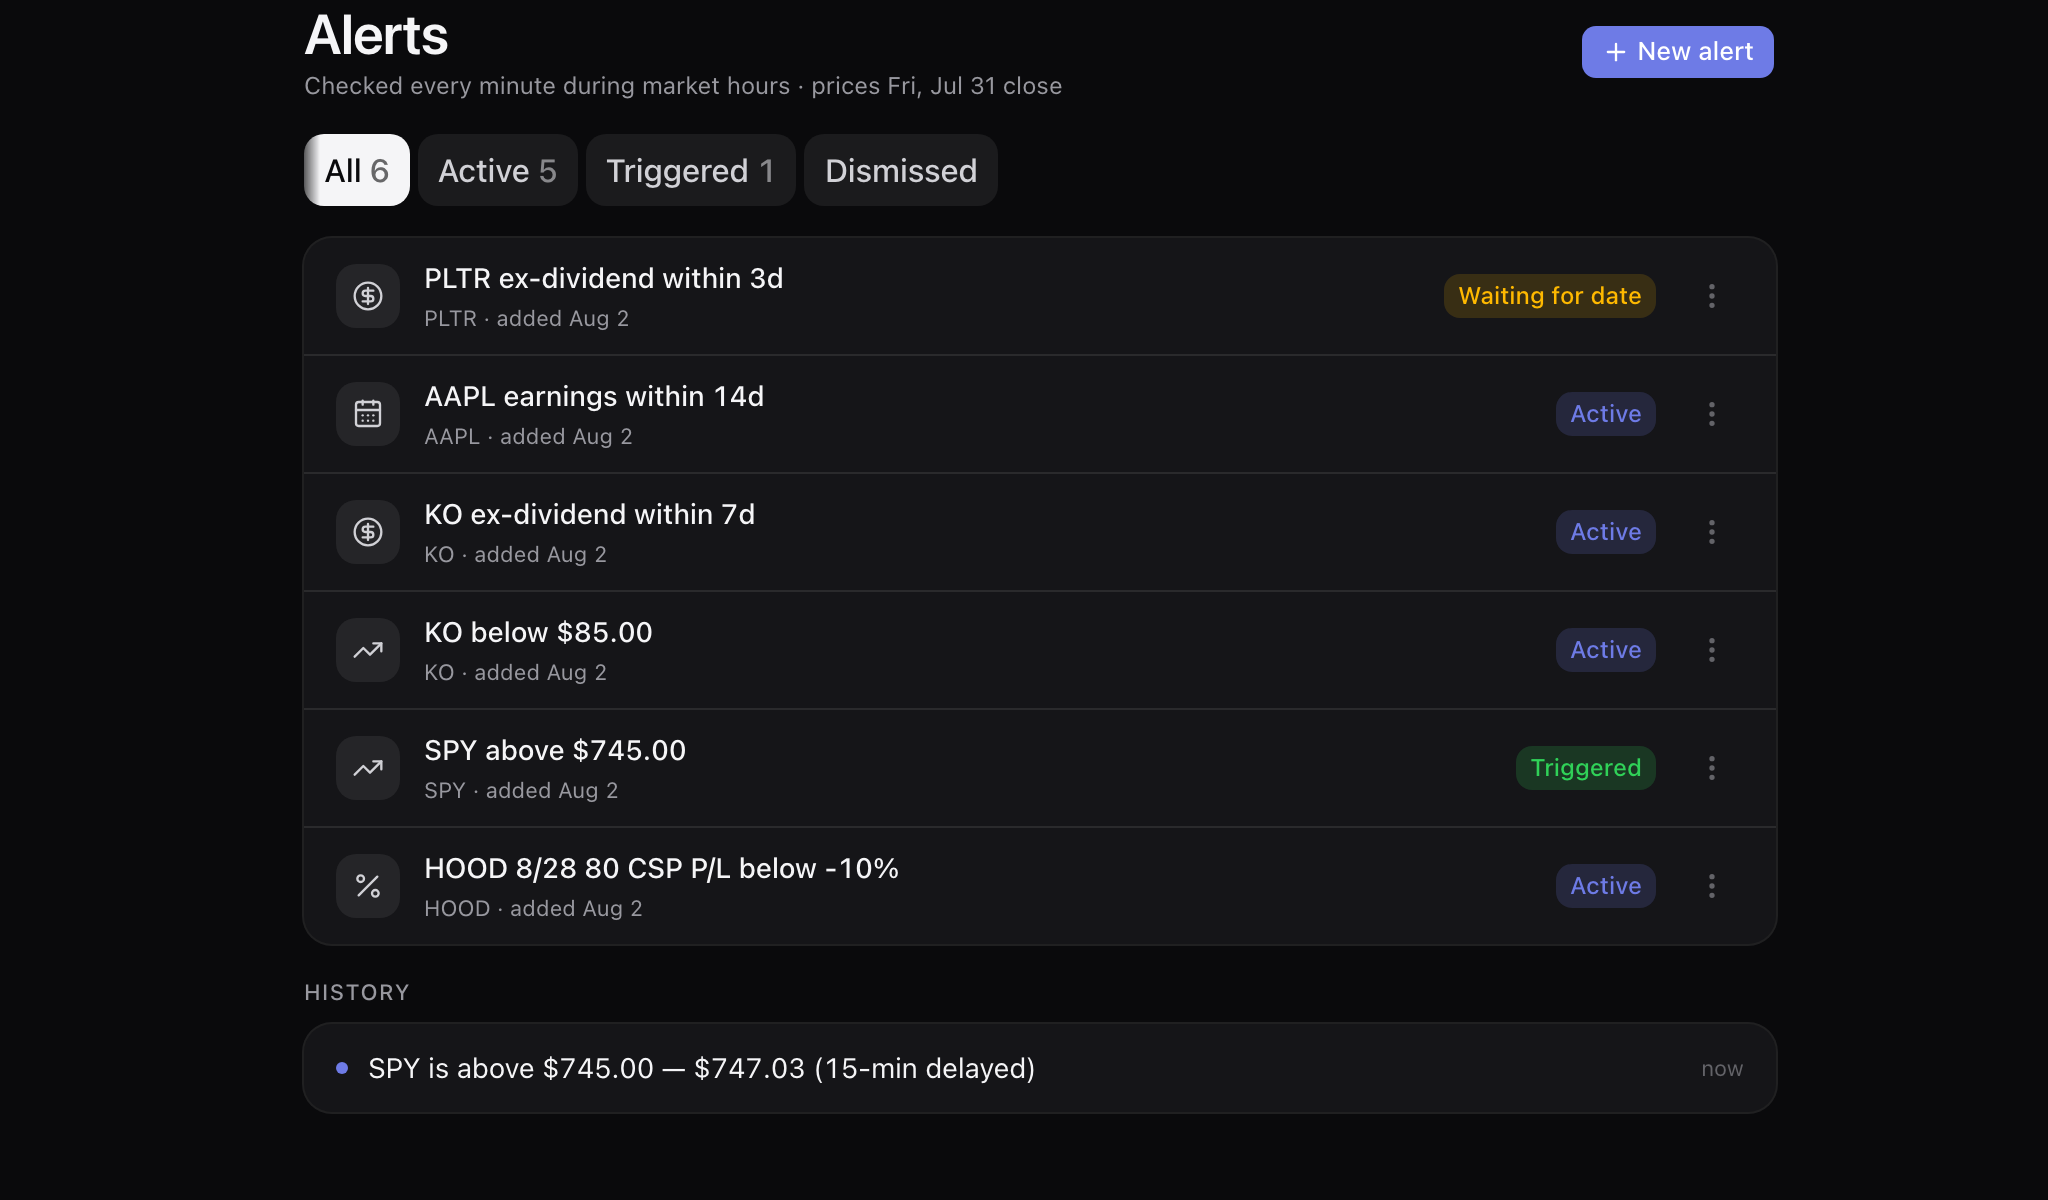
- Price: the SPY alert set above $745.00 has fired, and the history row keeps the print that fired it — “SPY is above $745.00 — $747.03 (15-min delayed)”. A fired alert moves to Triggered; it does not vanish.
- P/L on a position you hold: the saved HOOD 8/28 80 CSP carries one set to fire below −10% — measured against the entry you took, not against a round number.
- Ex-dividend: “PLTR ex-dividend within 3d” sits in Waiting for date until a date is published, rather than pretending it knows one. KO’s, three rows above it, is Active — that date is announced.
- Earnings: “AAPL earnings within 14d” sits on the list until the estimated report date falls inside that window, then fires naming the date and calling the estimate an estimate — “AAPL earnings ≈ Oct 30 … (estimated)”. The alert watches the calendar; which expiry that threatens is your call.
- Active, triggered and dismissed are separate lists; a fired alert moves, it does not vanish.
Share links
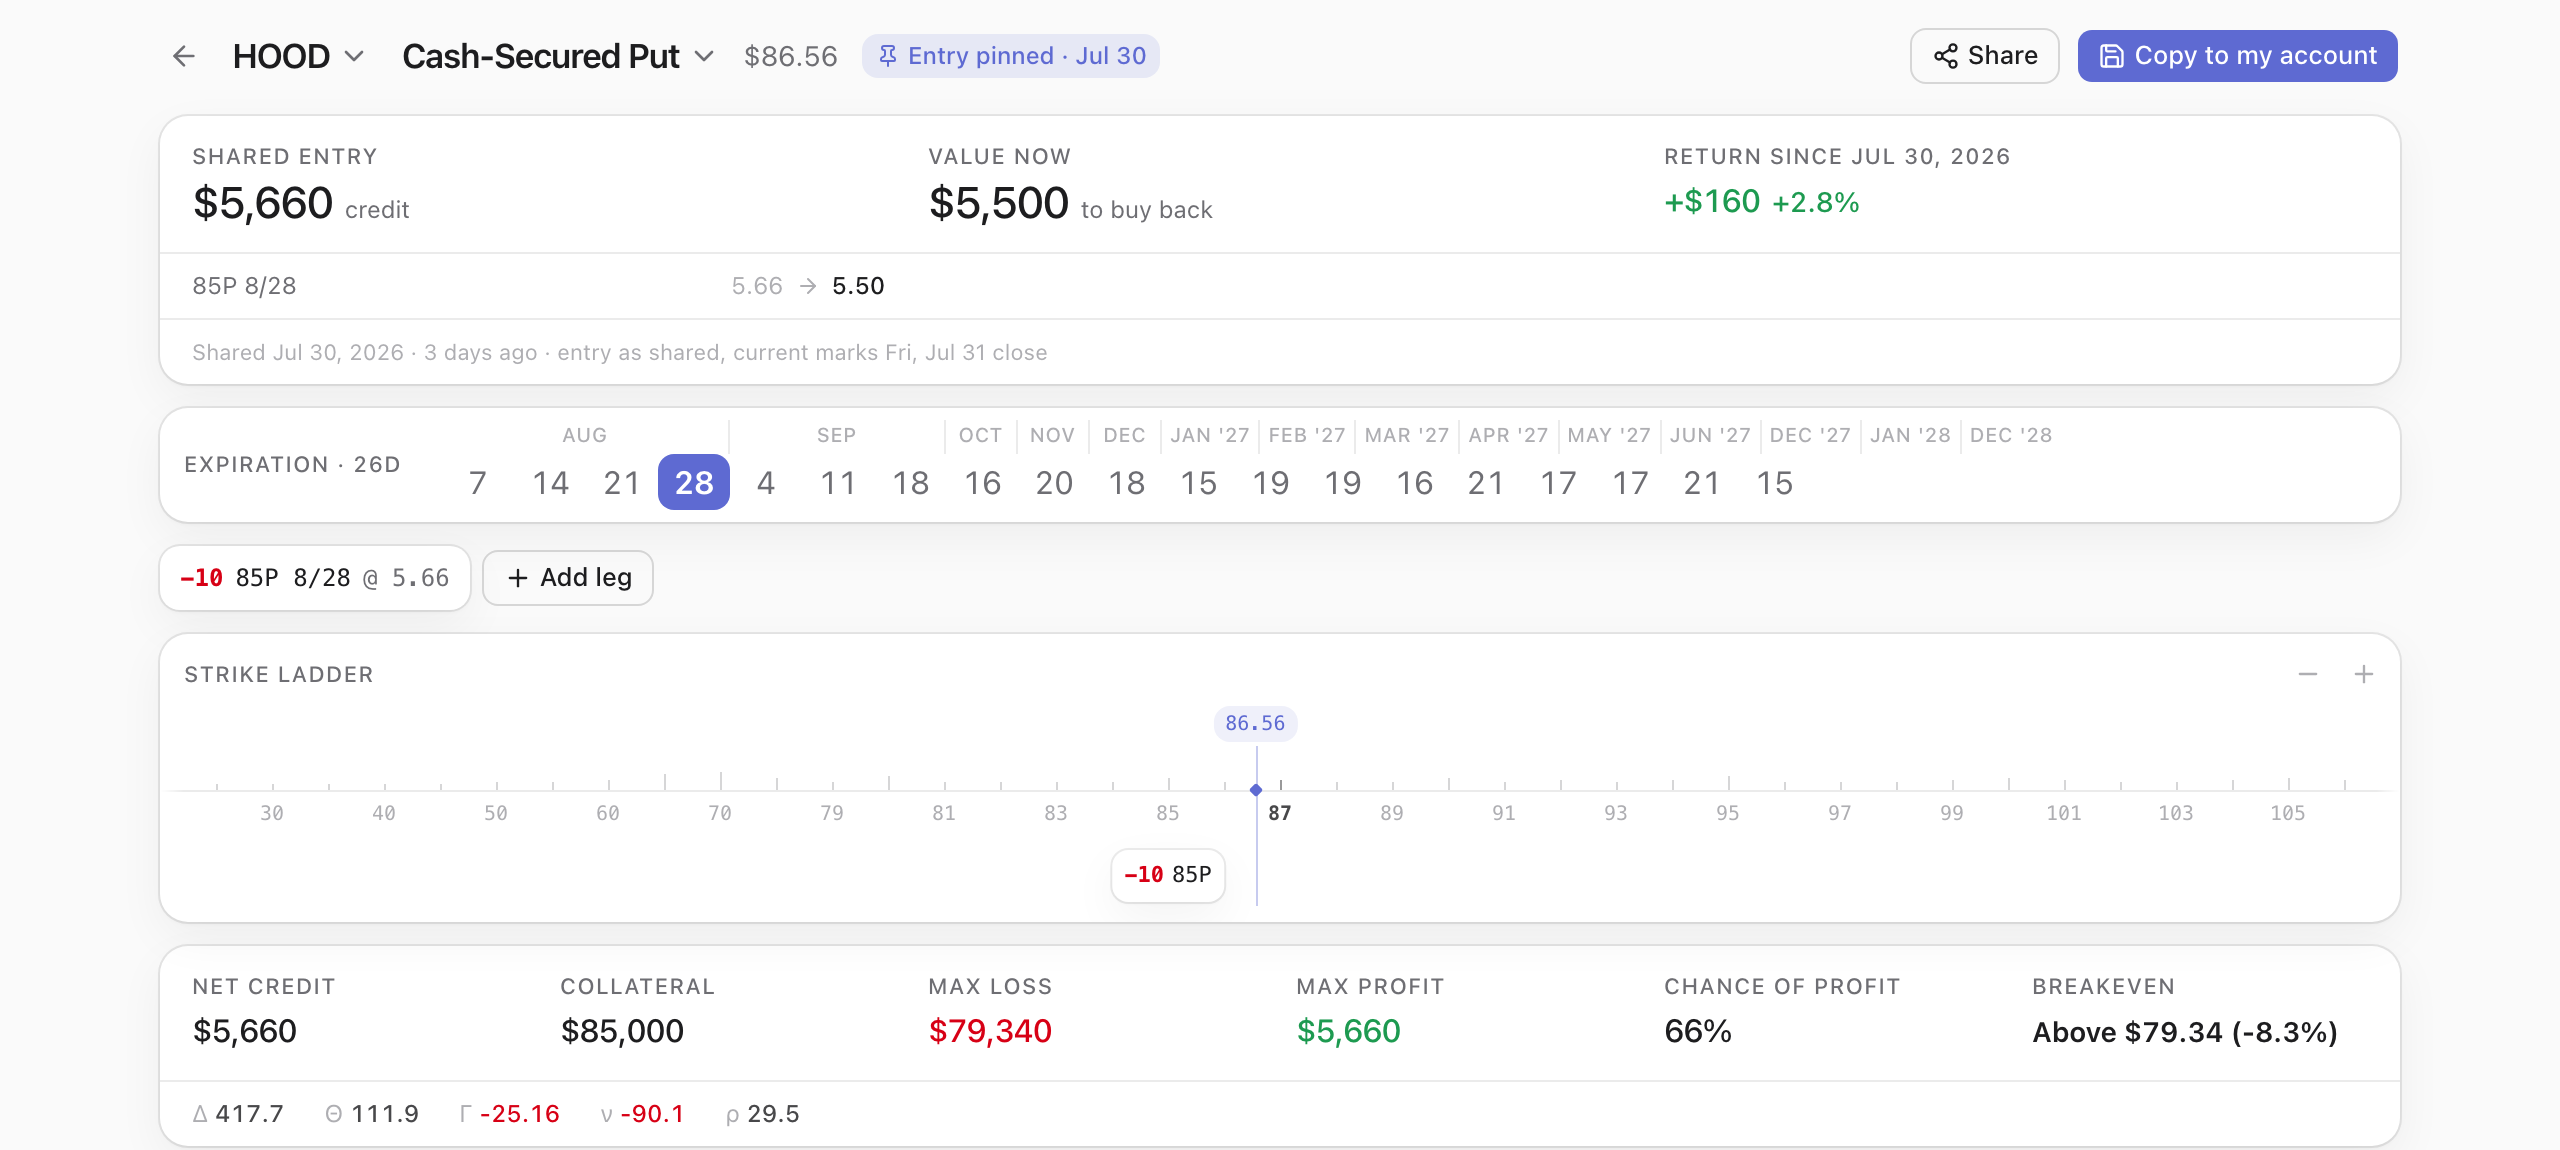
You post a trade on Thursday. Three days later the link still shows what you actually paid.
The builder URL is the share URL: the legs live in the path and it rewrites on every edit. Copying it pins your entry premiums and the date you took them, so the link keeps the trade you took and prices today’s mark next to it — for whoever opens it, with no account on either end.
No account
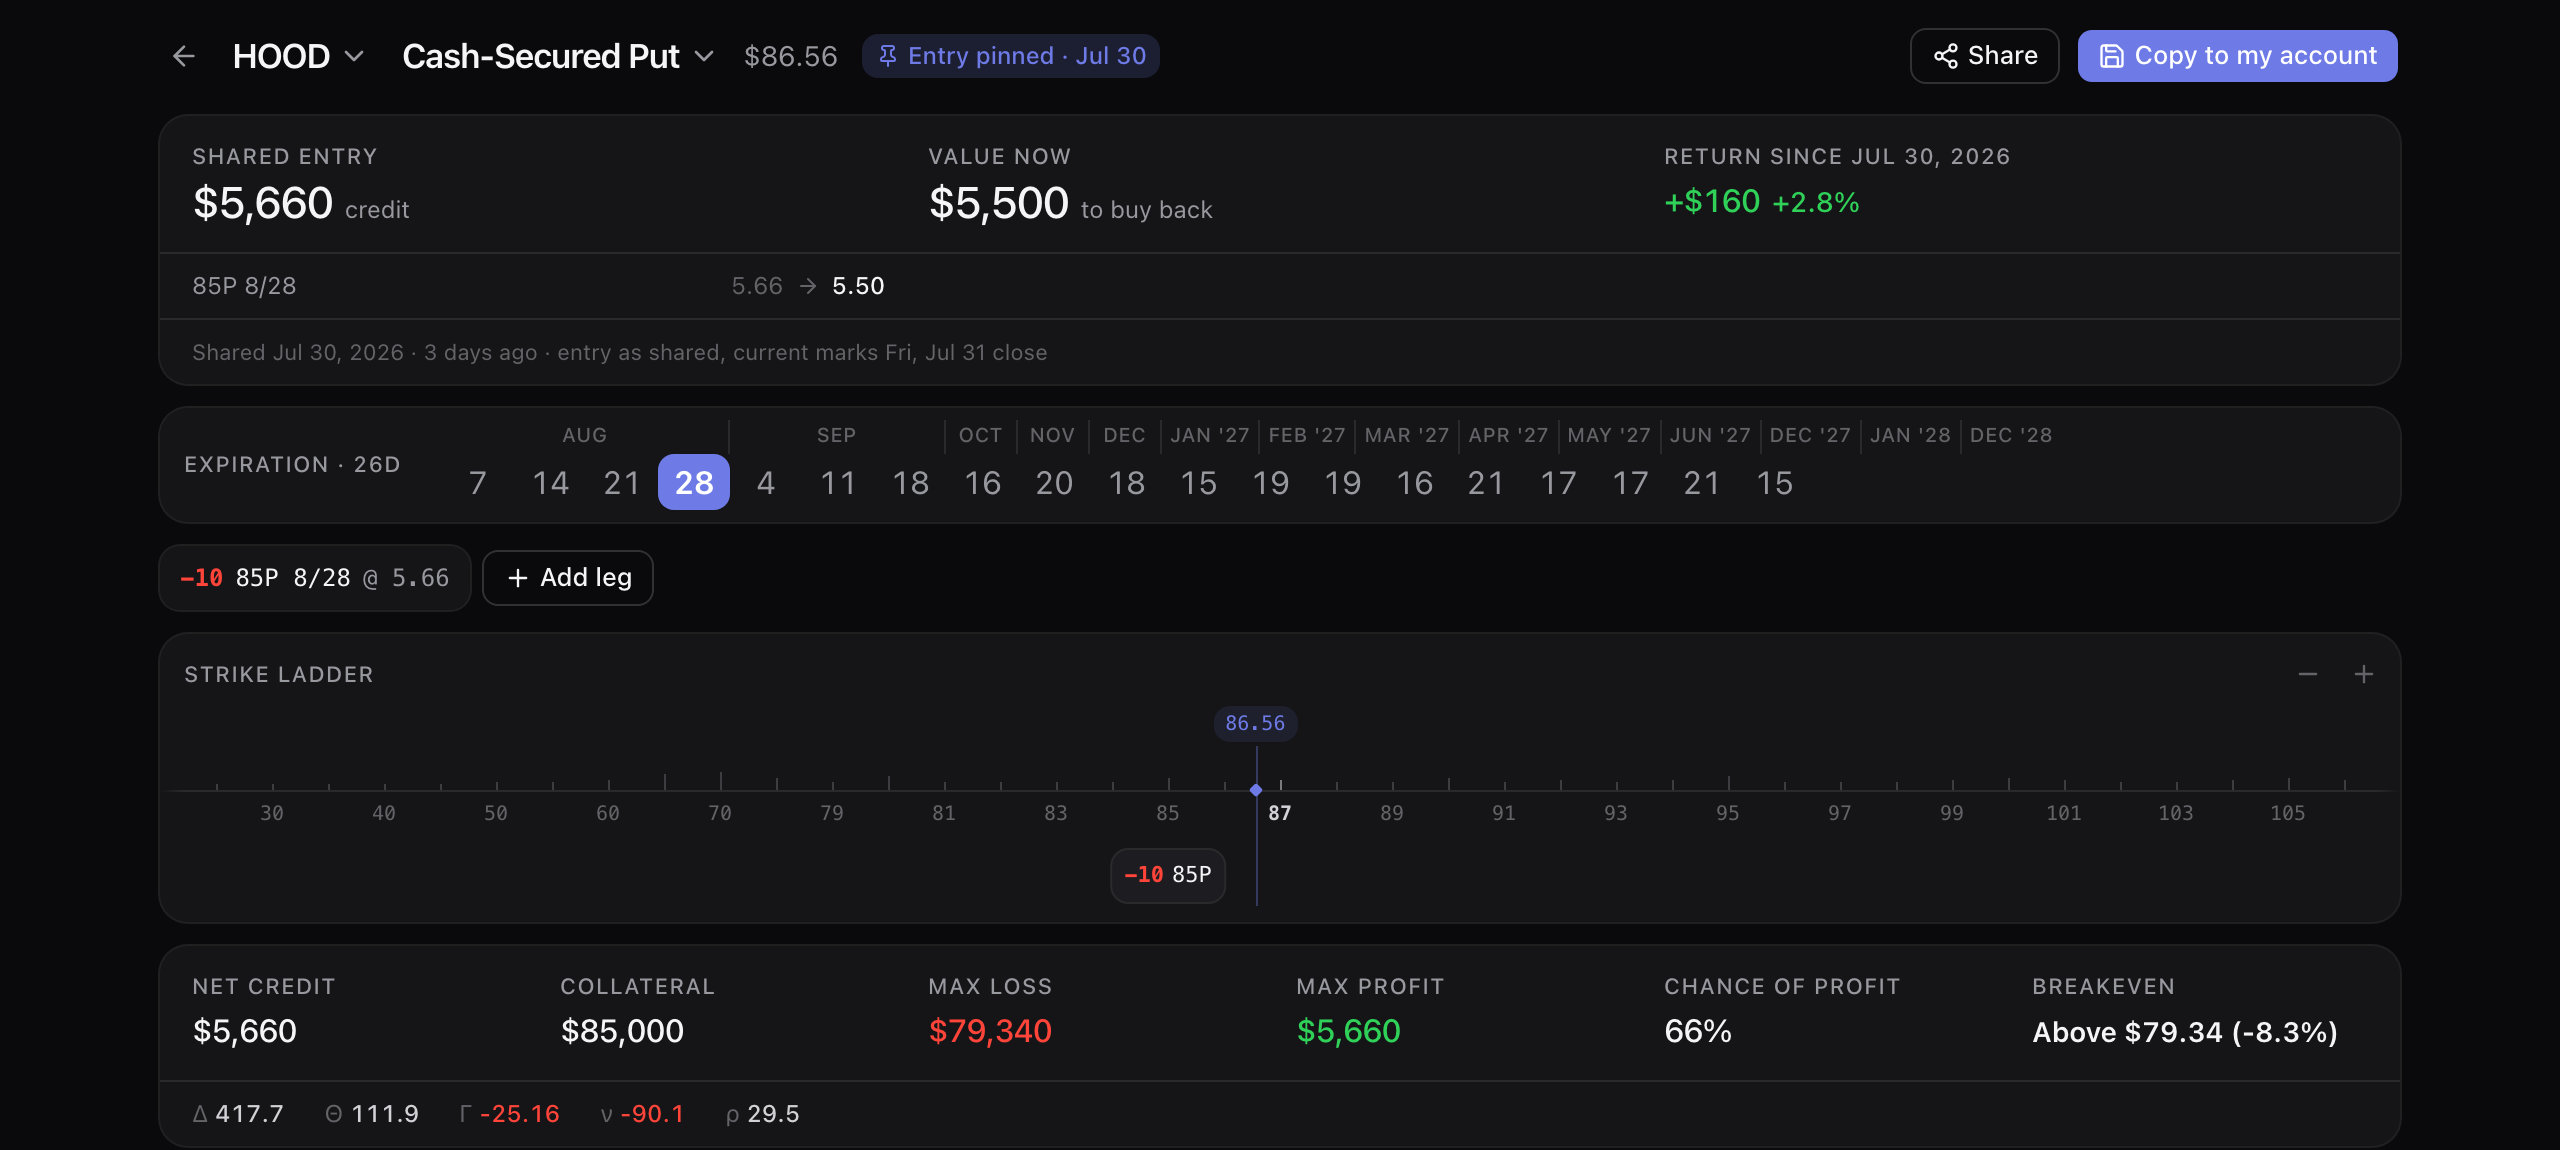
- Ten HOOD $85 puts sold 30 July at $5.66: shared entry $5,660 credit, $5,500 to buy back now, +$160 (+2.8%) since the day it was shared, with the leg reading 5.66 → 5.50.
- It tells you which kind of link you are on: “Entry pinned · Jul 30”, and underneath, “Shared Jul 30, 2026 · entry as shared, current marks Fri, Jul 31 close”, with the days since counted for you.
- A hand-typed or template link carries no pinned premiums, so it re-quotes live — and the two states never look alike.
- Whoever opens it can copy it into their own account, or just drag a strike and make it theirs.
- It unfurls as the payoff chart rather than as a bare URL, so the trade is legible before anyone clicks.
Optimizer
You have a view on SPY by 4 September. You want the structures that pay for being right.
Give it a target price and a date and it enumerates candidates from the real chain, prices every one and ranks them — then slide between maximum return and maximum chance and watch the trade-off move. It reads and prices a whole chain per request, so unlike the builder it asks for a free account first.
Free account
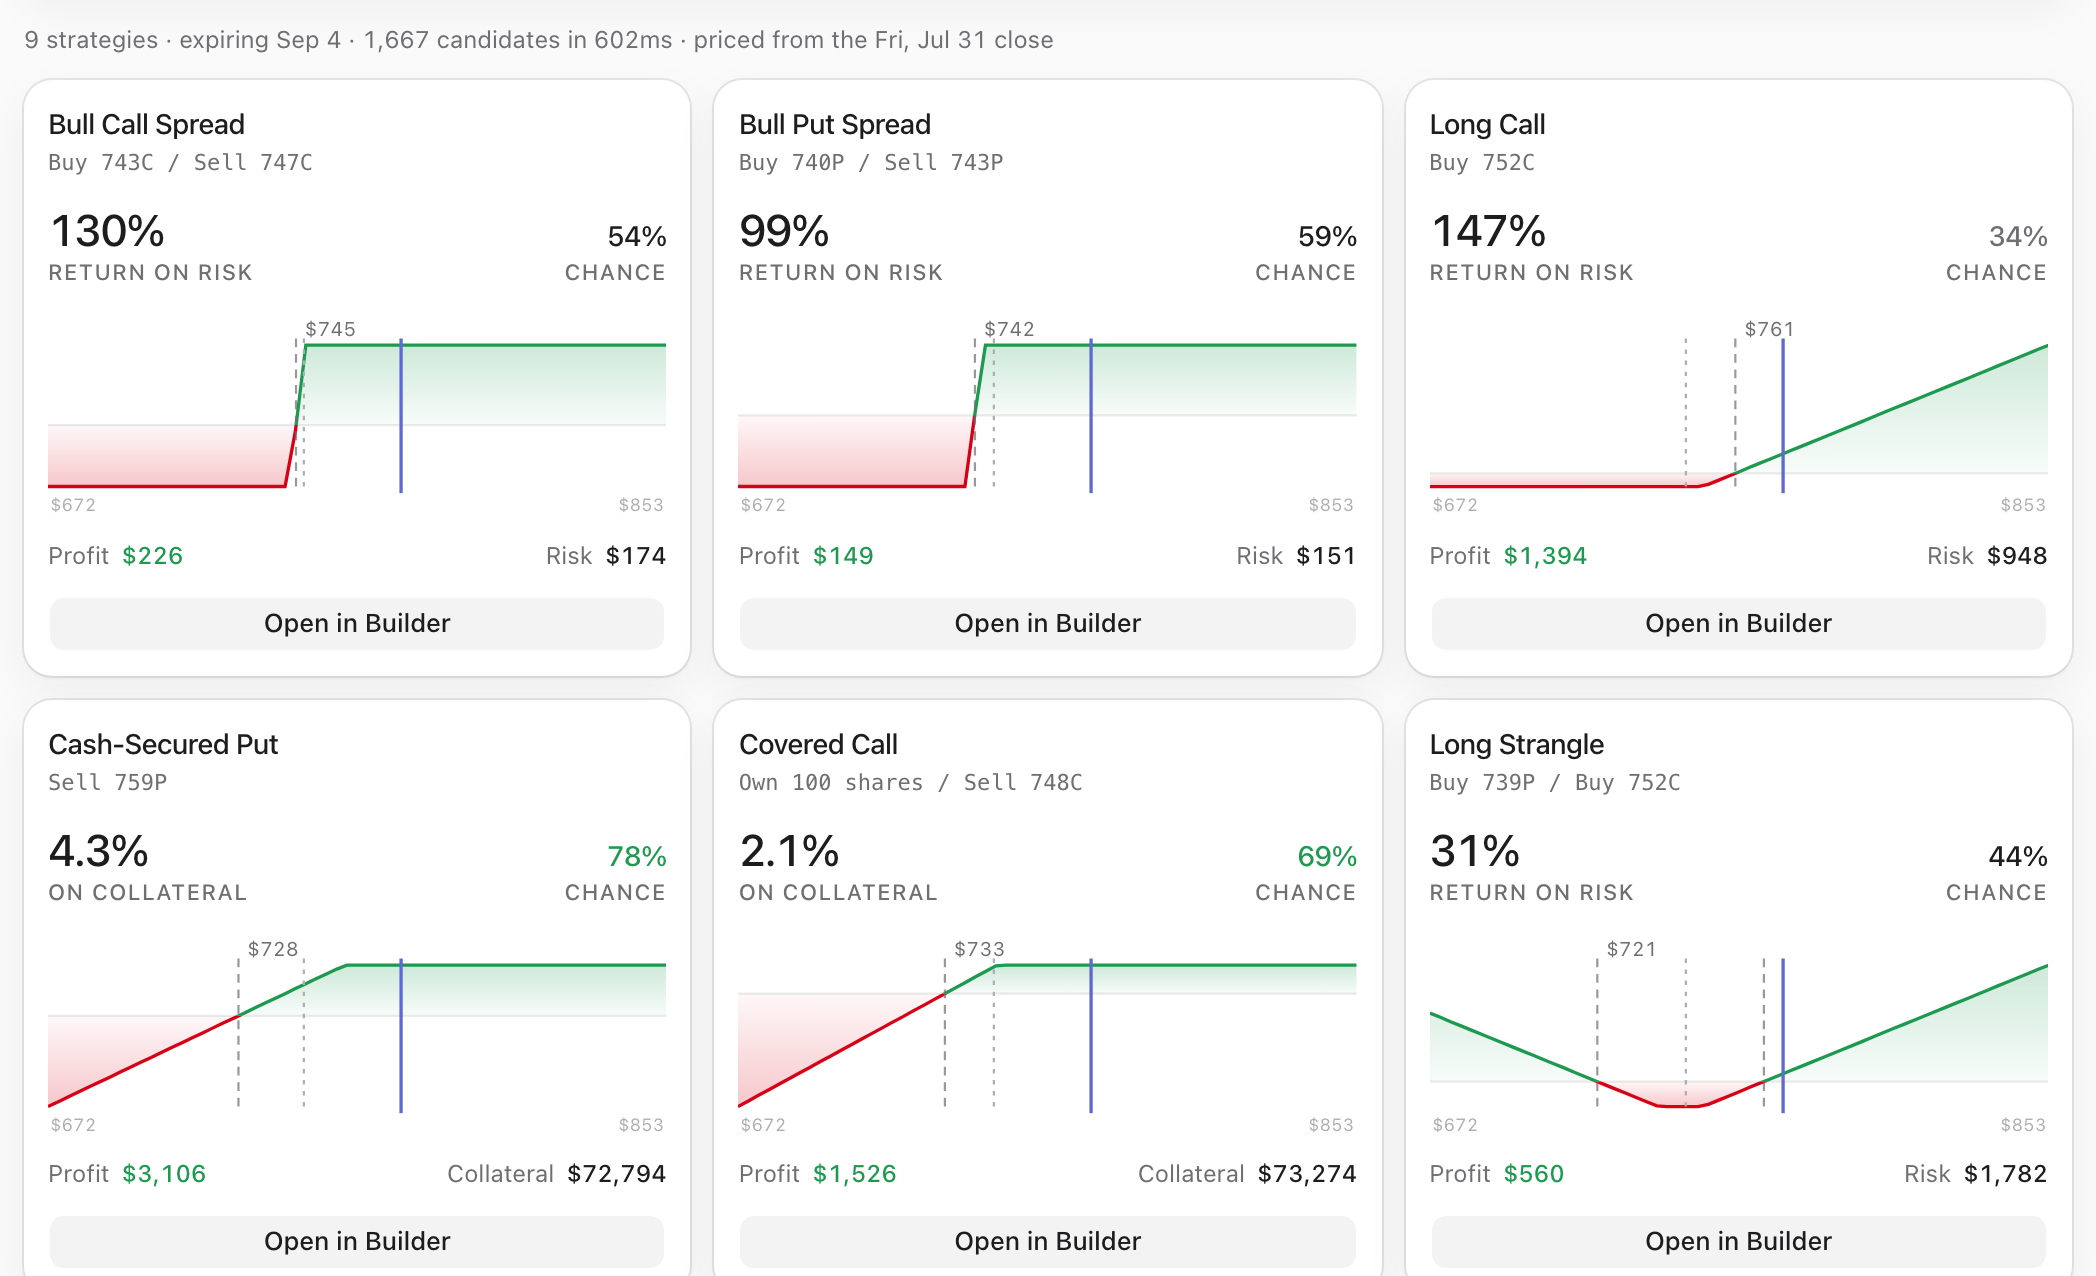
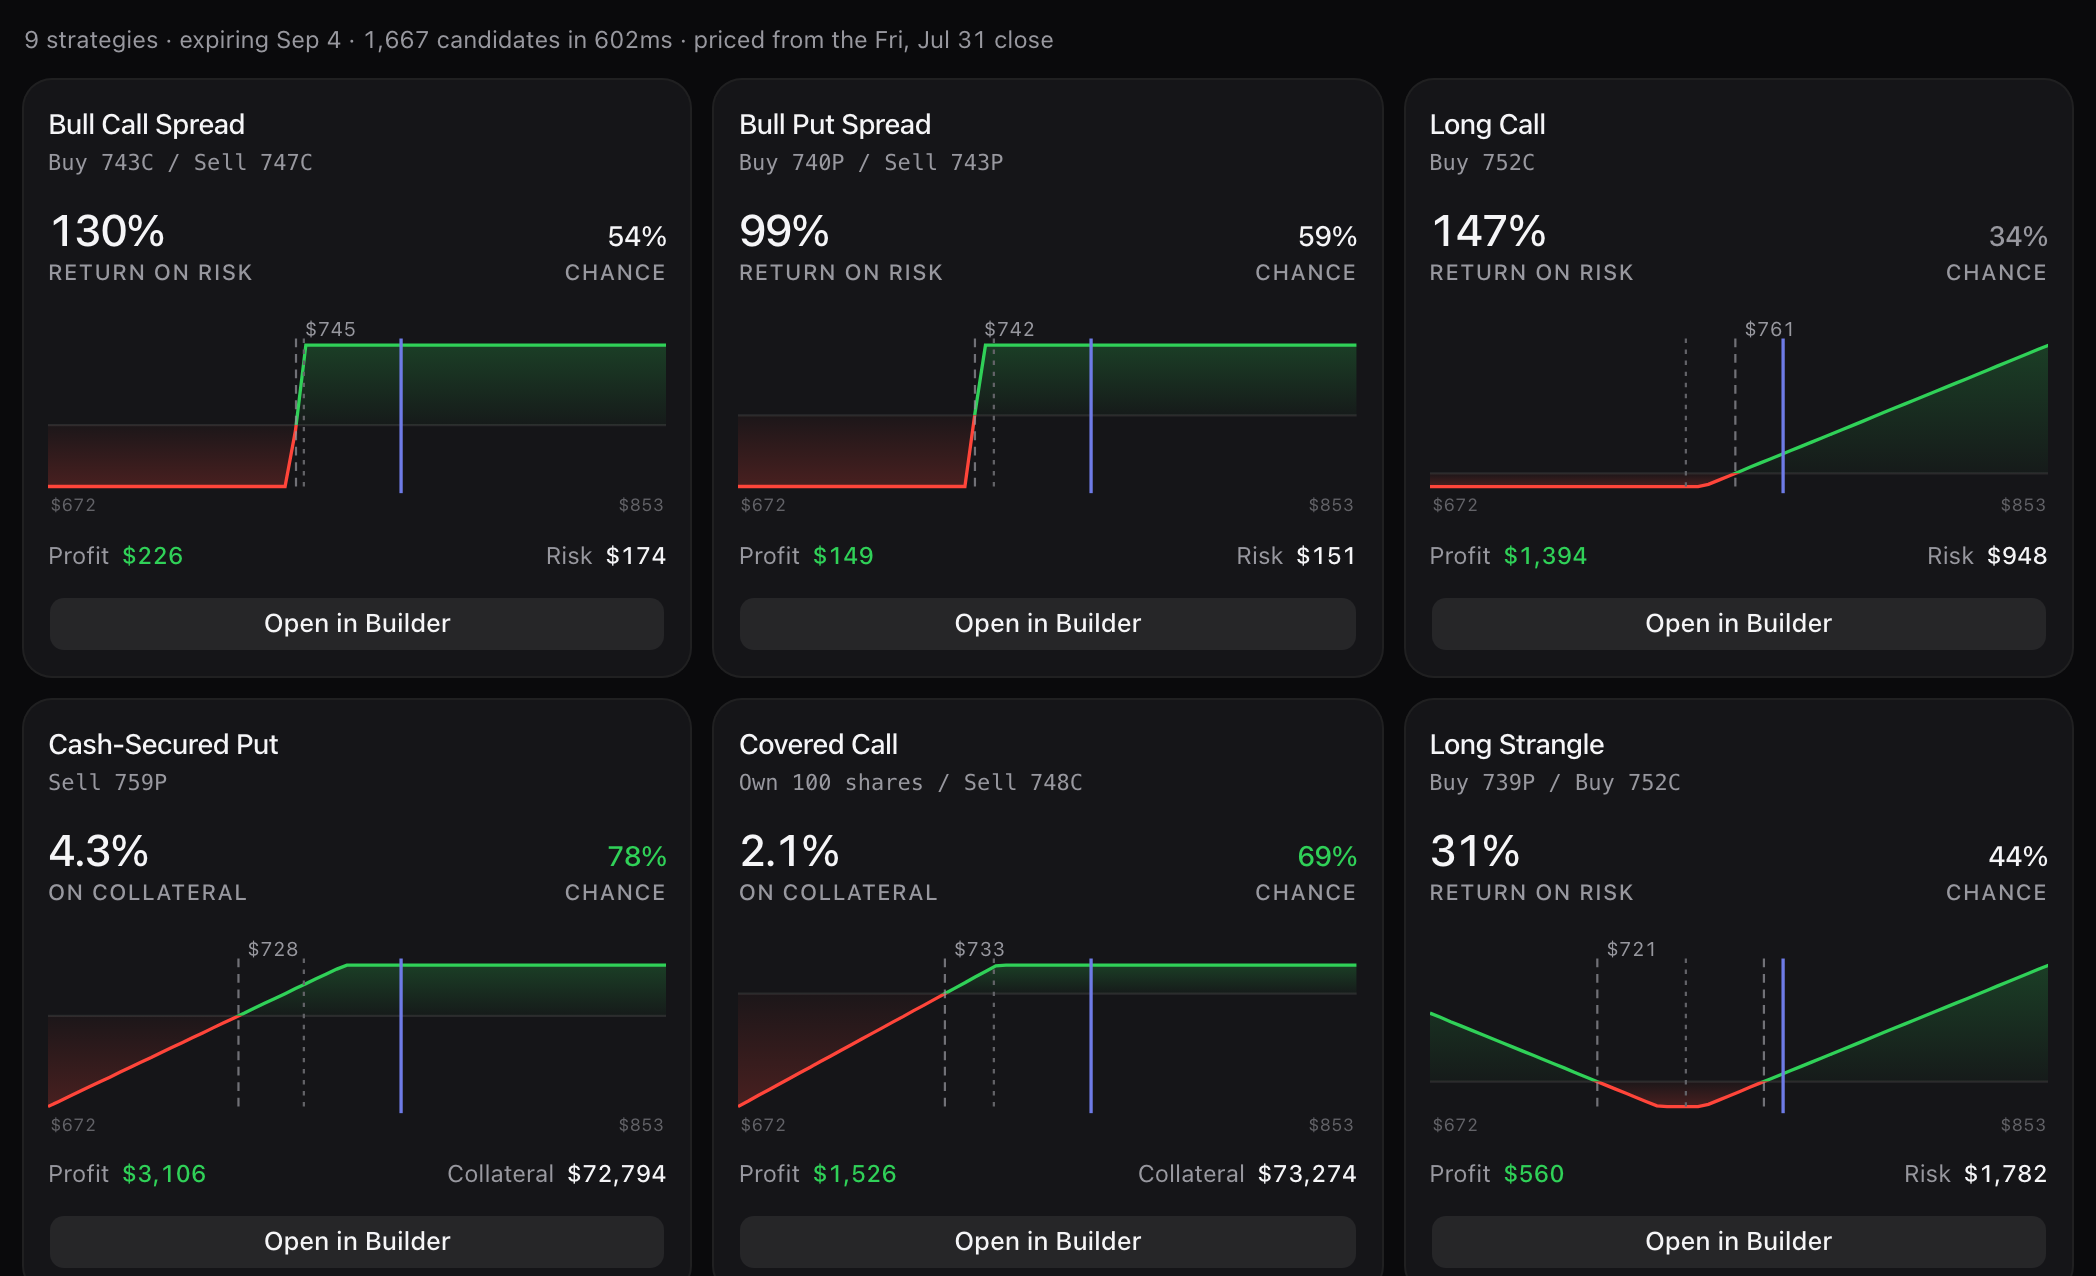
- 1,667 candidates enumerated and priced against the 31 July close in well under a second, ranked into 9 structures expiring 4 September.
- The aggressive end: a 743/747 call spread at 130% return on risk, 54% chance, $226 of profit against $174 at risk.
- The income end of the same view: sell the 759 put for 4.3% on $72,794 of collateral at a 78% chance, $3,106 max profit.
- Already own the shares? A covered call at 748 is 2.1% on $73,274 of collateral with a 69% chance and $1,526 of profit.
- Credit and debit structures rank against each other on one list: call and put spreads, long calls, straddles, strangles, cash-secured puts and covered calls, each priced on the same chain and scored the same way — so the income trade and the directional one are finally comparable.
- Every card opens in the builder with its legs, so a ranking is where you start rather than where you stop — and the builder itself never asks who you are.
Worked examples
The same arithmetic, run out in full
A PLTR wheel folded end to end, six MSFT put strikes ranked by annualized return and by the tail each one opens, covered calls on shares bought years ago, and what a $0.01 close does to a year of records. Every figure computed by the engine that prices the builder above.
- Strategy guideThe wheel strategy, with real numbersEveryone can recite the four steps. Almost nobody can tell you what a completed cycle returned on the capital it tied up. Here is one, priced off a real chain and folded by the same engine that runs our tracker.11 min read
- Strategy guideWhat a cash-secured put actually paysThe annualized-return column is the one everybody screenshots. It is also the one that tells you least. Here is the whole ladder — return, probability, breakeven, and the loss that takes six winners to repair.9 min read
- Strategy guideCovered calls on shares you already ownThe covered-call math you find online divides premium by cost basis. If you bought the stock years ago, that number is a fantasy — and it will talk you into selling a strike you should never have touched.9 min read
- MechanicsStrike selection with delta and IV"Sell the 30 delta" is the most repeated rule in retail options and nobody can tell you what it means. Here is what delta actually measures, where it stops matching probability, and how far off it gets on a high-IV name.10 min read
- OpinionWhy closing at $0.01 is wrongRecording an expired option as a close at $0.01 costs almost nothing in dollars. What it does to assignment history, cost basis and your recorded win rate is a $599 hole in the middle of a wheel — here is the arithmetic.10 min read
Put a strike ladder on a ticker you would actually take assignment on.
The builder, the chains, the trackers and the file importer cost $0 and ask for no card. A free account keeps 3 saved strategies; until you make one, the same 3 live in your browser and move across the day you sign up.